Figure 7.

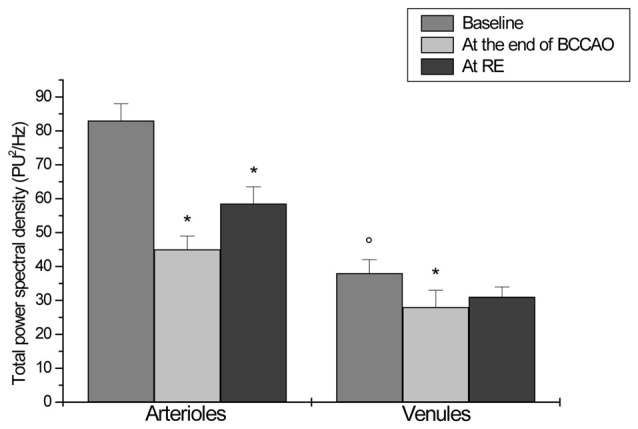
Total power spectral density (PSD), expressed as PU2/Hz, under baseline conditions, after 30 min BCCAO and at 60 min reperfusion in arterioles and venules of H group. *p < 0.01 vs. baseline, °p < 0.01 vs. arteriolar baseline value.

Total power spectral density (PSD), expressed as PU2/Hz, under baseline conditions, after 30 min BCCAO and at 60 min reperfusion in arterioles and venules of H group. *p < 0.01 vs. baseline, °p < 0.01 vs. arteriolar baseline value.