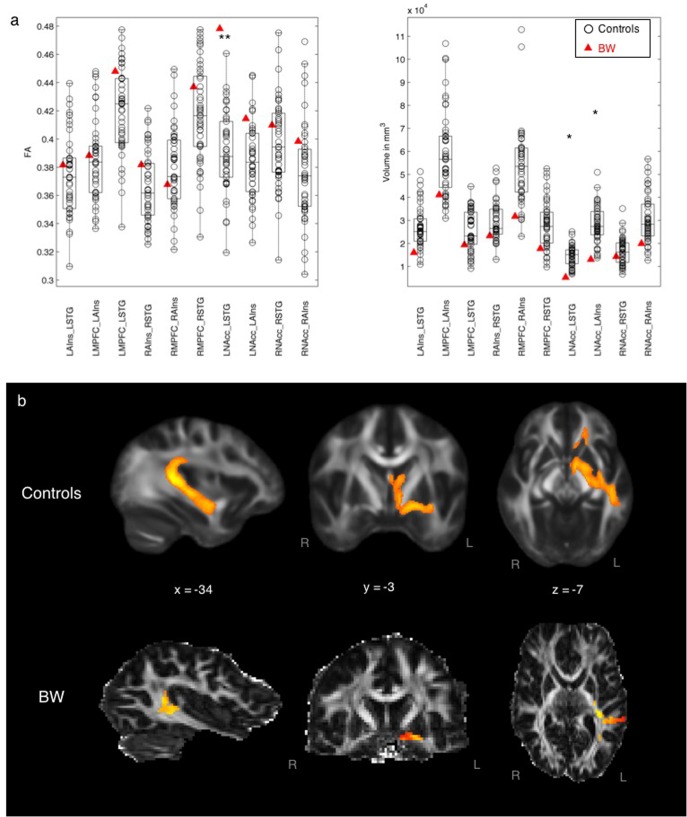
FIGURE 2.
(a) Left: Mean FA of each tract comparing BW and controls, controlling for volume differences. ∗∗p < 0.05 Bonferroni-corrected (0.05/10 = 0.005). Right: Volume of each tract comparing BW and controls. ∗p < 0.05 uncorrected. (b) Averaged tract between STG and NAcc for controls (top row) and for BW (bottom row).

