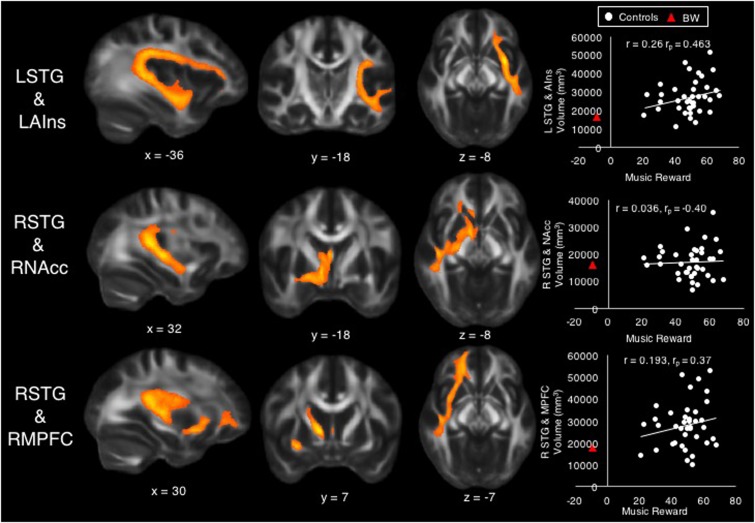
FIGURE 3.
Volumes of tracts between left superior temporal gyrus (STG) and left anterior insula (top), between right STG and right nucleus accumbens (middle), and between right STG and right medial prefrontal cortex (bottom) were significant predictors of the Music Reward score among control subjects. Scatterplots show bivariate correlations (r) between Music Reward score and the volume of each tract, as well as partial correlation coefficients (rp) from the regression for purposes of comparison against bivariate correlations. BW’s data are also shown on scatterplots for purposes of comparison.

