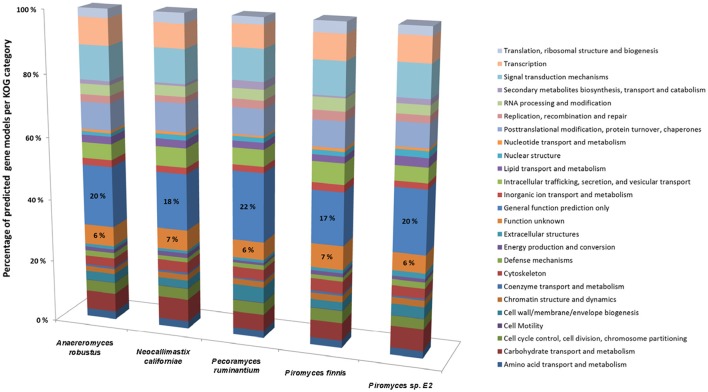
Figure 4.
Comparison of gene models identified by KOG classification in the anaerobic fungal genomes sequenced to date. Percentages of the predicted gene models identified are shown due to the differences in genome assembly size between the organisms (see Table 2), with the percentage values for two categories (Function unknown & General function prediction only) also directly stated on the bars. Data sourced from Youssef et al. (2013) and Haitjema et al. (2017).

