
FIGURE 3.
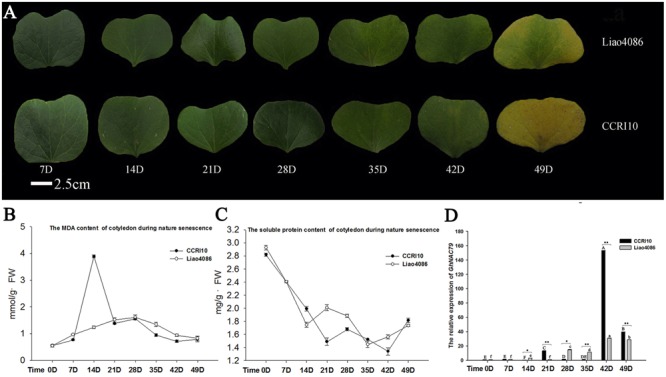
Expression patterns of GhNAC79 during cotyledon development. (A) Seven cotyledon developmental stages. Bar = 2.5 cm. (B,C) Changes in MDA and soluble protein contents during cotyledon development. D indicates the number of days after the cotyledon had spread out. (D) Expression patterns of GhNAC79 during cotyledon development. One-way ANOVA was based on varying the times for the two varieties. Different letters indicate a significant difference between two values (p < 0.01); capital letters are used for CCRI10 and lowercase for Liao4086. A t-test was conducted between two varieties at the same time point. ∗Values between two varieties are significantly different at the 0.05 confidence level; ∗∗Values between two varieties are significantly different at the 0.01 confidence level. Data are presented as the mean ± SD (n = 3). GhHIS3 was used as the reference gene.