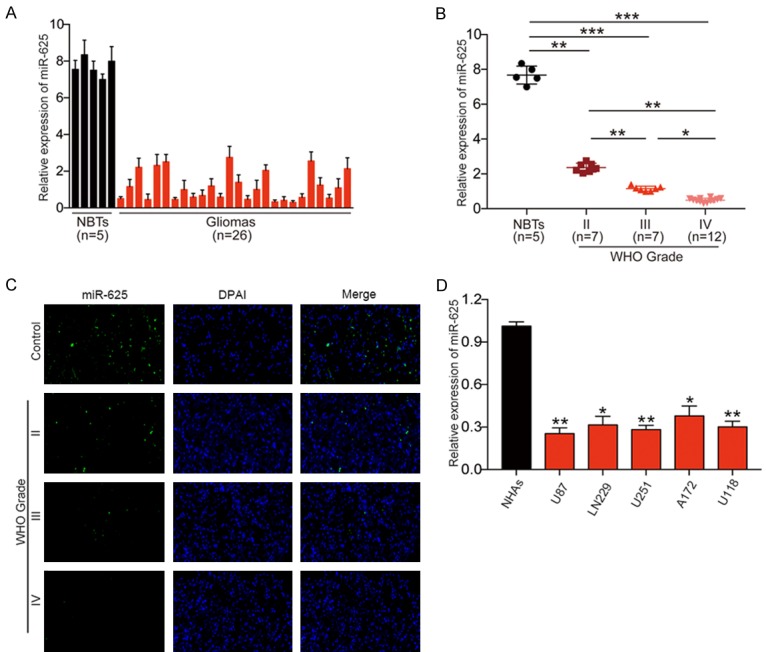
Figure 1.

Downregulation of miR-625 in glioma tissues and cell lines. A. qRT-PCR analysis of miR-625 expression in normal brain tissues (NBTs, n = 5) and glioma tissues (n = 26). B. qRT-PCR analysis of miR-625 expression in NBTs (n = 5) and glioma specimens (n = 26) divided according to WHO pathological classification criteria into grade II (n = 7), grade III (n = 7), and grade IV (n = 12). C. FISH analysis of miR-625 expression shows positive correlation with WHO grade in glioma specimens. D. qRT-PCR analysis of miR-625 expression in normal human astrocytes (NHAs) and five glioma cell lines (U87, LN229, U251, A172, U118). *P < 0.05, **P < 0.01, ***P < 0.001.
