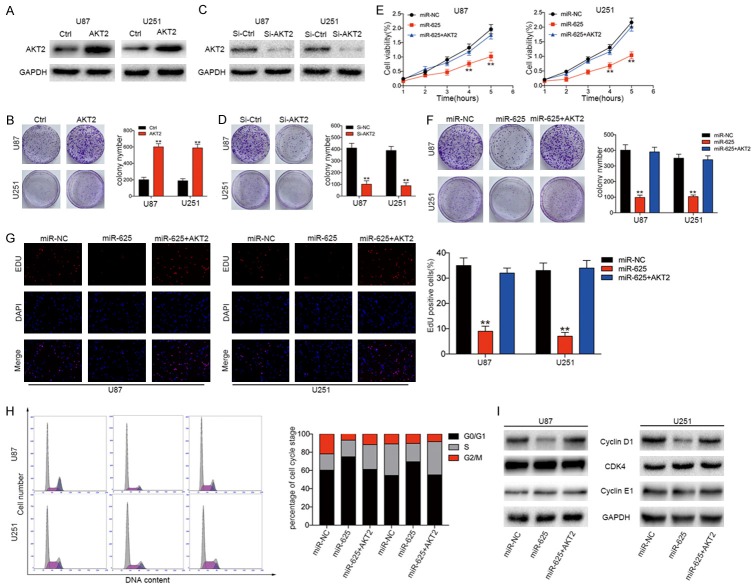
Figure 5.
AKT2 overexpression reverses the suppressive effects of miR-625 on glioma cells in vitro. (A) Western blot analysis of AKT2 expression in U87 and U251 cells expressing control (Ctrl) or AKT2 overexpression vectors. GAPDH served as the loading control. (B) Western blot analysis of AKT2 expression in U87 and U251 cells after transfection with control (si-Ctrl) or AKT2-targeting siRNA (si-AKT2). GAPDH served as the loading control. (C) Representative images and quantification of colony-forming assays of control or AKT2-overexpressing U87 and U251 cells. (D) Representative images and quantification of colony-forming assays of U87 and U251 cells transfected with si-AKT2 or si-Ctrl. (E-H) CCK-8 viability assay (E), colony-forming assay (F), EDU proliferation assay (G), and cell cycle distribution assay (H) of U87 and U251 cells transfected with miR-NC, miR-625, or miR-625+AKT2. (I) Western blot analysis of AKT2 and downstream effector proteins Cyclin D1, CDK4, and Cyclin E1 in U87 and U251 cells transfected with miR-NC, miR-625, or miR-625+AKT2. GAPDH was used as the loading control. **P < 0.01.

