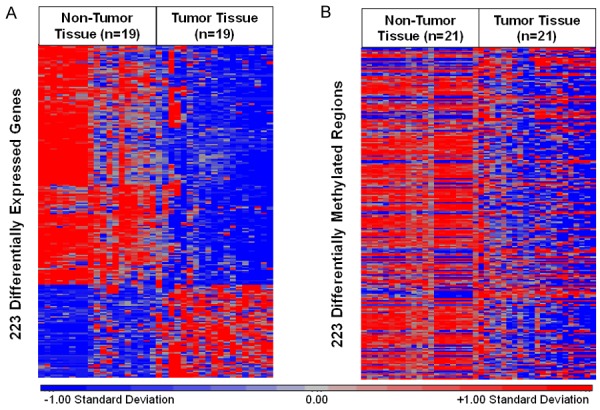
Figure 2.

A. A total of 223 DEGs in n = 19 matched controls and cases. Red indicates relatively higher expression. Blue indicates relatively lower expression. B. A total of 223 DMRs with strongest correlation to gene expression in n = 21 matched non-tumor and tumor tissues. Red indicates relatively higher levels of methylation. Blue indicates relatively lower levels of methylation.
