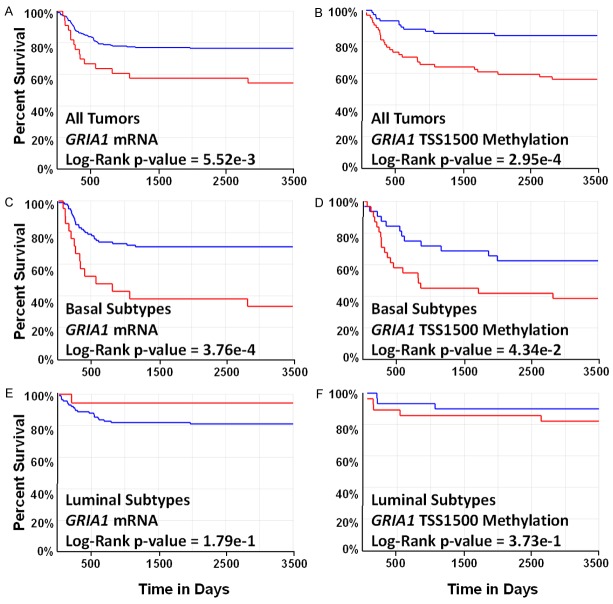
Figure 4.
Differences in TCGA patient survival associated with GRIA1 mRNA expression and TSS1500 CpG methylation levels. In all plots, blue represents low levels of expression or methylation and red represents high levels of expression or methylation. A. Kaplan-Meier plot of overall survival in subjects with low versus high GRIA1 mRNA expression. B. Kaplan-Meier plot of overall survival in subjects with low versus high GRIA1 TSS1500 methylation levels. C. Kaplan-Meier plot of overall survival in subjects with basal-like bladder cancer with low versus high GRIA1 mRNA expression. D. Kaplan-Meier plot of overall survival in subjects with basal-like bladder cancer with low versus high GRIA1 TSS1500 methylation levels. E. Kaplan-Meier plot of overall survival in subjects with luminal-like bladder cancer with low versus high GRIA1 mRNA expression. F. Kaplan-Meier plot of overall survival in subjects with luminal-like bladder cancer with low versus high GRIA1 TSS1500 methylation levels.

