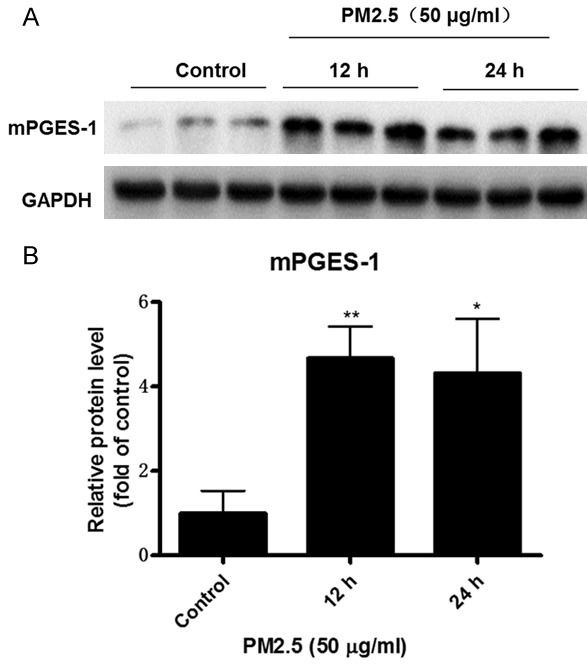
Figure 4.

PM2.5 induced mPGES-1 expression in endothelial cells. Mouse aorta endothelial cells were treated with PM2.5 (50 μg/ml) at different time points (0, 12, and 24 h). A. Western blotting analysis of mPGES-1. B. Densitometric analysis of mPGES-1 Western blots. The values represent the means ± SD (n=6 in each group). *p<0.05 vs. Control group. **p<0.01 vs. Control group.
