Figure 2.

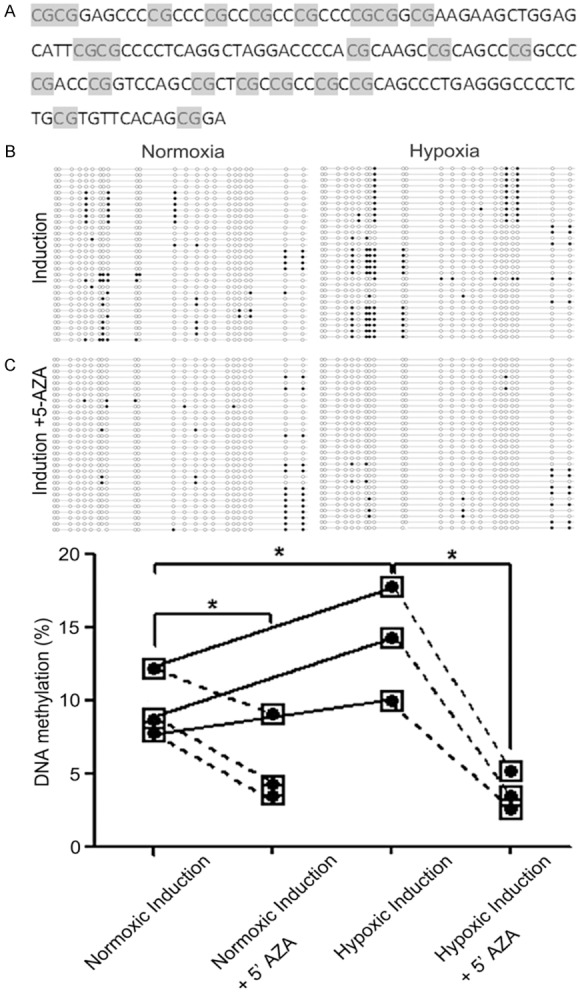
CpG Island methylation in the miR-124-3 promoter region under normoxic and hypoxic conditions. The percentage of CpG islands that were methylated was determined by PCR of bisulfite-treated genomic DNA extracted from C3H10T1/2 cells grown in pellets under normoxic (21% O2) or hypoxic (2% O2) conditions. A: The 140 bp DNA fragment in the promoter region of miR-124-3 that contains 23 CpG sites is shown. B: BGS analysis was conducted using 3 paired normoxic and hypoxic pellets. The promoter region was cloned into a pMD-18T vector for amplification and 10 clones from each pellet were sequenced of the miR-124-3 CpG island in 3 pairs of pellet samples. Each horizontal line indicates a single clone and each vertical column is an individual CpG site. Methylated sites are shown by a black circle and the demethylated sites are shown by a white circle. The number of methylated sites is shown in the absence and presence of the DNA demethylating agent 5’-AZA. C: Graphical representation of the percentage of methylated sites in paired samples under normoxic and hypoxic conditions in the presence and absence of 5’-AZA. Methylated CpG sites are shown by black circles. Each point indicates the mean. The differences in DNA methylation levels in different groups were analysis by Kruskal-Wallis test. *P<0.05.
