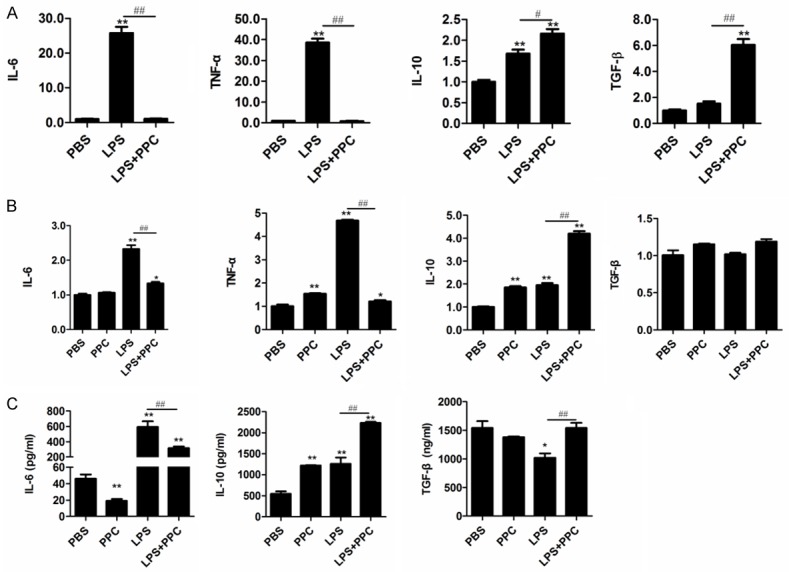
Figure 2.

The effect of PPC on LPS-triggered cytokine production in Raw264.7 cells and mouse primary macrophages. Cells were stimulated by PPC (5 µM) with or without LPS (100 ng/ml) for 24 h. The mRNA expression of IL-6, TNF-α, IL-10, and TGF-β in Raw264.7 cells (A) and mouse primary macrophages (B) were examined by Real time RT-PCR. The concentrations of IL-6, TGF-β, and IL-10 in the supernatants were measured by ELISA (C). Data are shown as mean ± SD of three independent experiments. Comparisons among multiple groups were done using one way ANOVA. PPC, LPS, LPS+PPC vs PBS, *, P<0.05, **, P<0.01; LPS vs LPS+PPC, #, P<0.05, ##, P<0.01.
