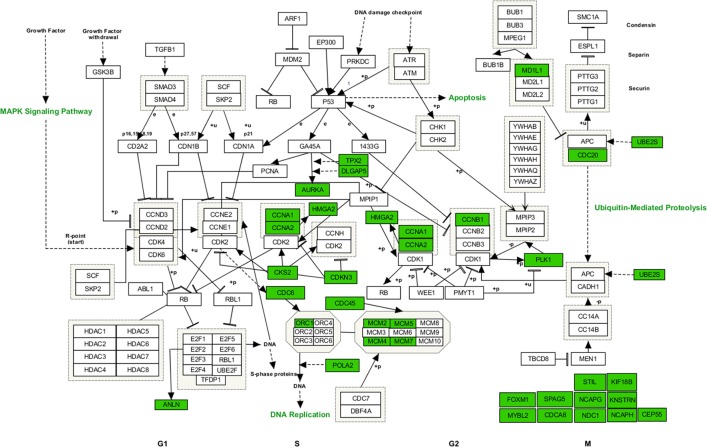
Figure 2.
Upregulated genes involved in cell cycle regulated processes at 7 days after a single dose of 2 Gy X-rays. Arborescence diagram indicates cell cycle pathway with the identified upregulated genes indicated in green. Pathway diagram was adapted from Wikipathways and modified with Pathvisio. Changes are shown compared to gene expression in sham irradiated cells (N = 3, n = 12).

