Figure 5.

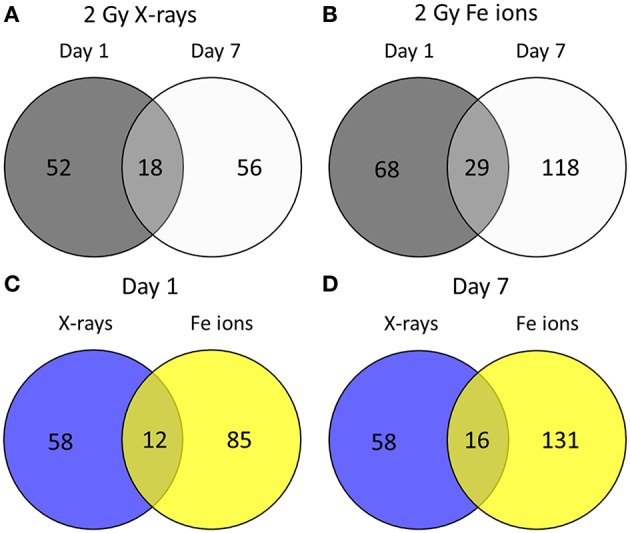
Irradiated ECs demonstrate a larger number of differentially expressed proteins after Fe ion exposure in comparison to X-ray exposure. Venn diagrams indicate the numbers of differentially expressed proteins after exposure to a single 2.0 Gy dose of X-rays (A) or Fe ions (B). The protein expression changes after low and high LET irradiation are compared on day 1 (C) and on day 7 (D). Changes are shown compared to protein expression in sham irradiated cells, as described in section Materials and Methods (N = 3, n = 12).
