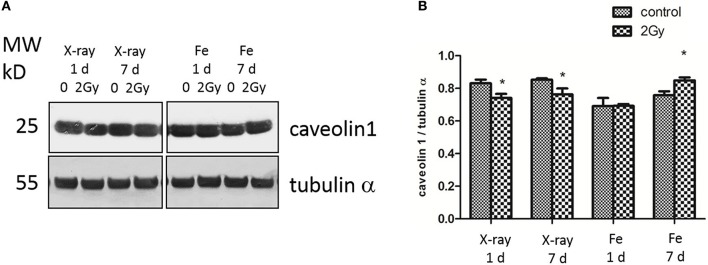
Figure 7.
X-ray irradiated ECs exhibit a persistent downregulation of caveolin-1, whereas Fe ion exposure induces a caveolin 1 upregulation. (A) Caveolin-1 (cav-1) and α-tubulin protein expression analyzed using western blot after cell exposure to a single 2.0 Gy dose fo X-ray or Fe ions. (B) Data represent the cav-1/α-tubulin ratio in control and irradiated samples after background correction and normalization to α-tubulin expression. Data show means ± SEM (N = 3, n = 12). *p < 0.05 using two-sided t-test (Welch-test).

