Figure 1.
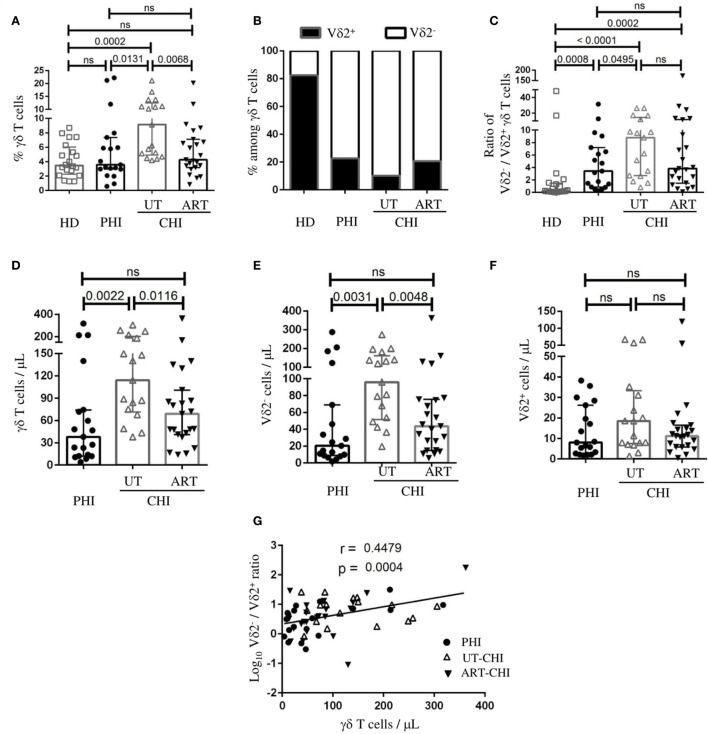
Distribution of γδ T cells and its subsets in peripheral blood. Peripheral blood mononuclear cells were stained ex vivo for γδ T cells, as well as its subsets (Vδ2− and Vδ2+), and compared between healthy donors (HD), and patients with primary HIV infection (PHI), as well as chronic HIV infection (CHI)—untreated (UT) and treated with ART (ART). (A) Frequency of γδ T cells among T cells. (B) Graphical representation of frequencies of Vδ2− and Vδ2+ cells within γδ T cells. (C) Comparison of the ratio of Vδ2−/Vδ2+ cells among γδ T cells. Comparison of absolute numbers of (D) γδ T cells, (E) Vδ2− cells, and (F) Vδ2+ cells between PHI, untreated chronic HIV infection (UT-CHI), and ART-CHI. (G) Correlation between absolute count of γδ T cells and log10 Vδ2−/Vδ2+ ratio among γδ T cells in all HIV-infected patients. Data are displayed as median and IQR. Mann–Whitney and Spearman rank correlation tests were performed. Spearman rank correlation coefficient (r) is indicated in the panel. p-Values are indicated as significant when <0.05; ns, non-significant.

