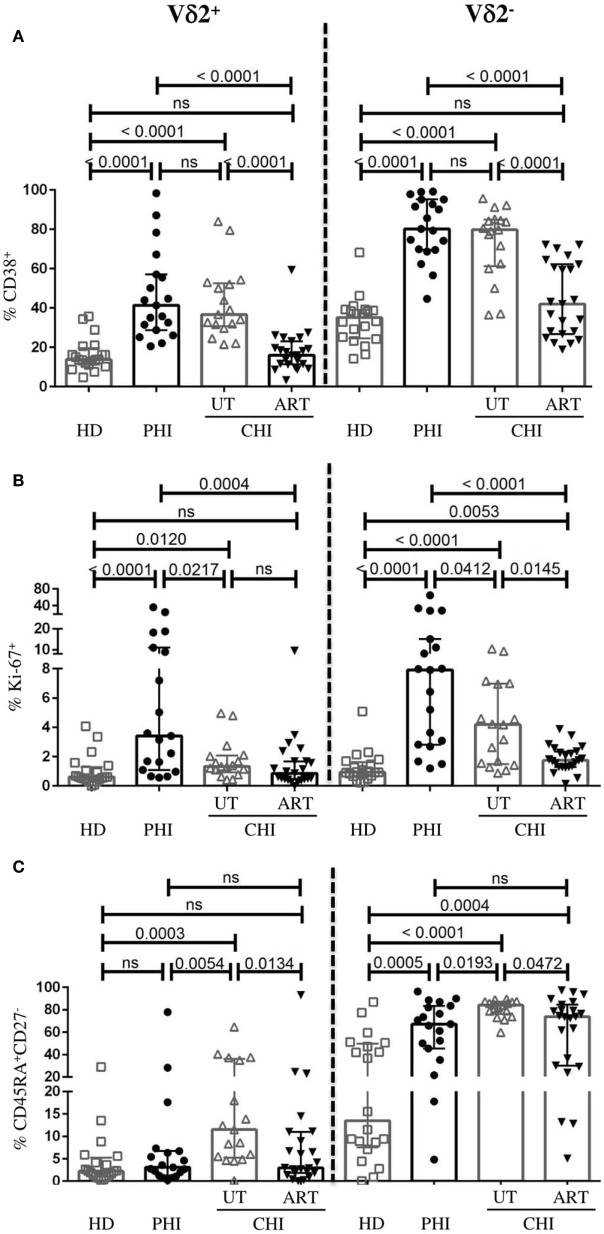
Figure 3.
Phenotypic profile of Vδ2− and Vδ2+ γδ T cells. Comparison of frequencies of Vδ2− and Vδ2+ γδ T cells expressing the following phenotype (A) CD38+, (B) Ki-67+, and (C) CD45RA+CD27− between healthy donors (HD), and patients with primary HIV infection (PHI) as well as chronic HIV infection (CHI)—untreated (UT) and treated with ART (ART). Data are displayed as median and IQR. Mann–Whitney test was performed. p-Values are indicated as significant when <0.05; ns, non-significant.

