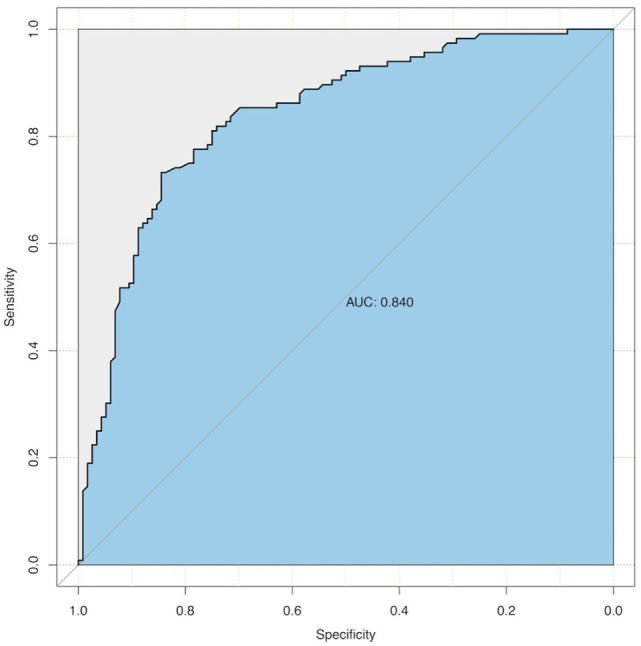
Figure 2.

ROC curve of the predictive value of BMI for eICA tortuosity. Increasing BMI was predictive of eICA tortuosity, area under the curve = 0.84; 95% confidence interval, 0.79–0.89; p < 0.001. The optimal predictive threshold of BMI for eICA tortuosity was 25.04 kg/m2. eICA, extracranial internal carotid artery; BMI, body mass index.
