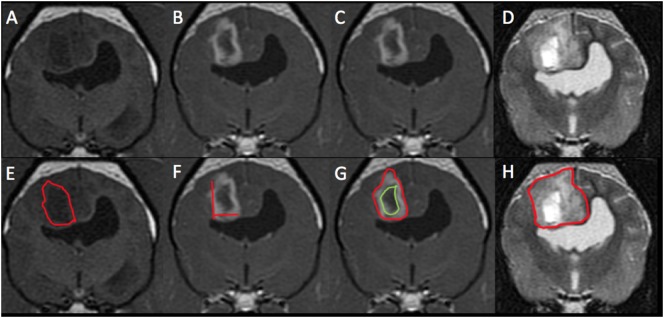
Figure 2.
Magnetic resonance imaging (MRI) images from the same patient from Figure 1 with histological high-grade astrocytoma. This mass was diagnosed on MRI as high grade (3/3 reviewers) and an astrocytoma (2/3). Panels (A,E) represent pre-contrast T1-weighted (T1W) images. The red outline on image (E) represents the hand-drawn region of interest (ROI) for volume calculation. Panels (B,C,F,G) are T1W post-contrast images. The two lines on image (F) represent the two-dimensional McDonald method of lesion measurement. The red outline on image (G) represents the hand-drawn ROI for total lesion volume. The green outline represents non-contrast enhancing (CE) lesion volume and the space between the two outlines represents the ROI for CE lesion only. Panels (D,H) are T2-weighted pre-contrast images. The red outline on image (H) represents T2 hyperintense volume.

