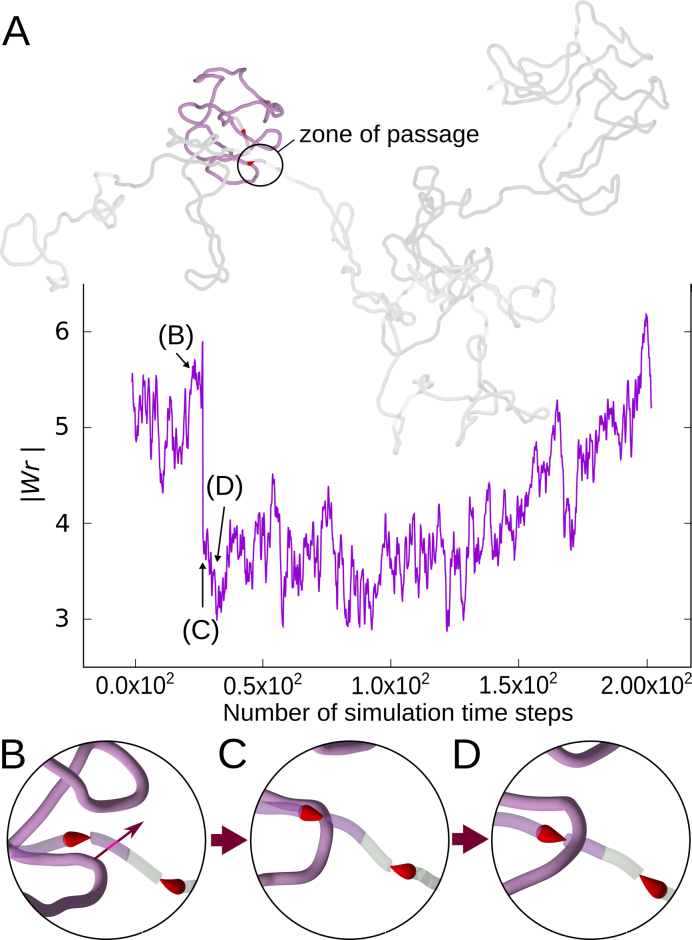
Figure 3.
Homeostatic control of supercoiling. (A) Evolution of writhe in one domain (highlighted in blue) within thermally equilibrated chromosome fragment with 10 domains. The snapshot of the entire chromosome fragment is taken at the beginning of the simulation interval for which the writhe profile is shown. After about 25 simulation steps during which writhe was changing moderately there was a simulation step time during which writhe has changed by ∼2. Such a change is an indication of an intersegmental passage. (B–D) Snapshots of the zone of passage (encircled in A), showing the progress of one intersegmental passage. Simulation time steps corresponding to these snapshots are indicated with arrows in the writhe profile. The writhe profile shows that after the initial drop of the magnitude of writhe after the passage, the writhe values tend to return to the level before the passage.

