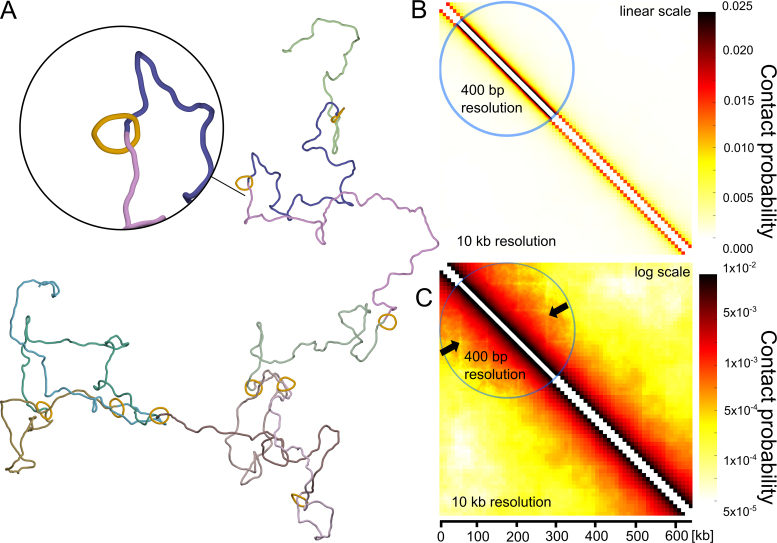
Figure 4.
Simulations testing the cohesin barrier model. (A) Snapshot from the simulation of chromatin fibres with encircling cohesin rings maintained at regular intervals. (B and C) Contact maps obtained for a large statistical sample of equilibrated configurations such as shown in A. In B, the applied colour scale is linear as the one used in the experimental contact maps of Mizuguchi et al. (11) and in the simulated contact maps presented in Figure 2. In C, the applied colour scale is logarithmic. Notice that the presence of localized cohesin rings results in a local depletion of contacts at chromatin portions shielded by the rings, but does not result in formation of characteristic triangles indicating presence of self-interacting domains. The arrows indicate lines with depleted contacts.

