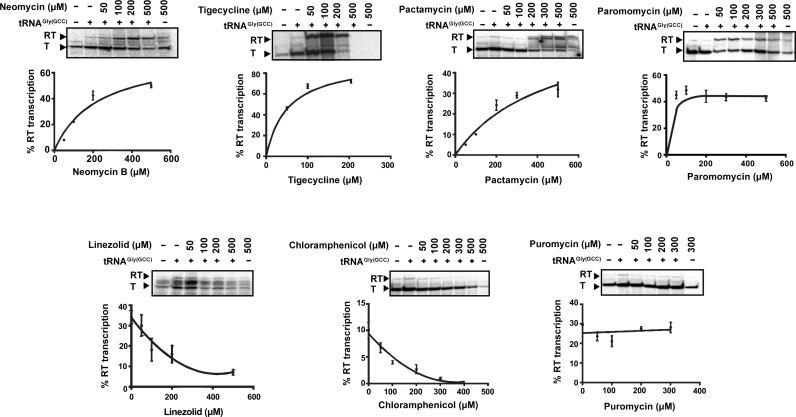
Figure 2.
Dose-response curves showing the effect of increasing concentration of antibiotics on the S. aureus glyS T-box transcription antitermination, in vitro. The values for the curves were extracted after analysis of representative autoradiograms (insets) as described in Materials and Methods. All reactions were performed twice in duplicates and error bars represent ± SD from the corresponding experiments. T and RT correspond to transcription termination and transcription readthrough, respectively.

