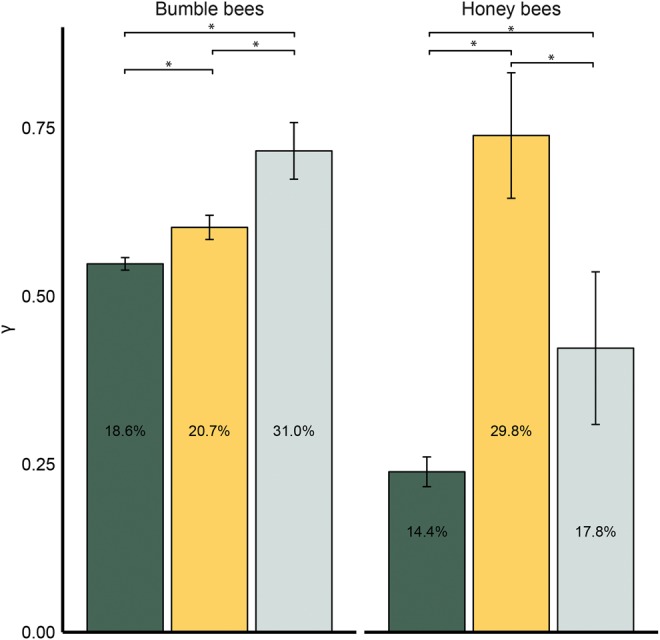
Fig. 3.

—In Apis (right) genes associated with nonreproductive phenotypes (gold bars) show signs of adaptive evolution relative to genes expressed in reproductives (silver bars; F2,1688 = 11.97; P = 0.0000007; Tukey P < 0.01 for all comparisons); however, in Bombus (left), this pattern in reversed and genes expressed in female reproductive castes show signs of positive selection greater than those expressed in workers (F2,5640 = 10.7; P = 0.00002; Tukey P < 0.03 for all comparison). Error bars denote SEM; Percentages within bars are percent genes with high gamma (γ > 1). Green = nondifferentially expressed genes.
