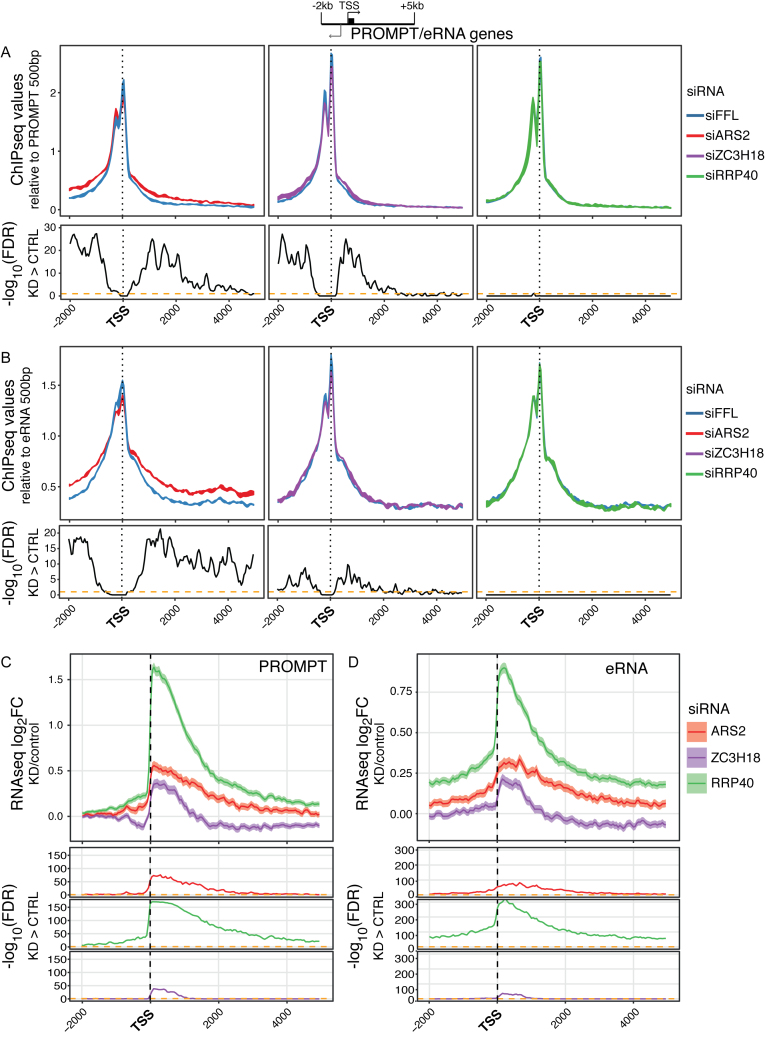
Figure 4.
(A and B) RNAPII ChIP-seq values plotted as in Figure 2A but for regions 2 kb upstream and 5 kb downstream the TSSs of selected PROMPTs (A, n = 1097) and eRNAs (B, n = 2552) (see schematics on top). Values were scaled to the ChIP signal within the first 500 bp from the TSS. Experiment displays and FDR calculations as in Figure 2A. (C and D) Profile plots of log2FC between mean signals of the indicated triplicate RNA-seq libraries and their controls. Regions as in (A) and (B). Calculation and display as in Figure 2C.

