Figure 3.
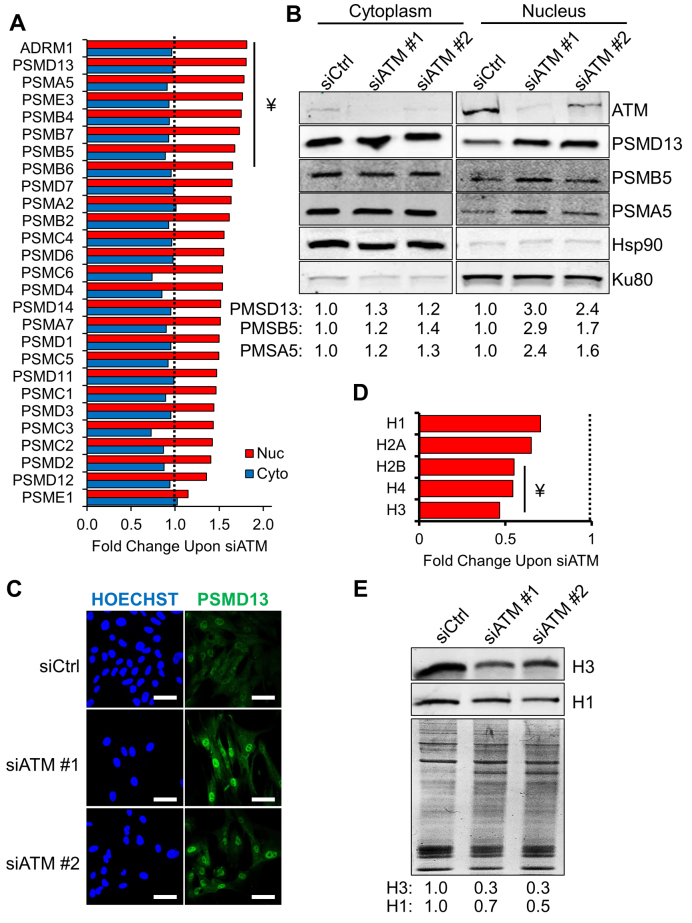
Accumulation of nuclear proteasome and degradation of histones in ATM-depleted fibroblasts. (A) Proteomics data showing the fold change of proteasome subunit levels in fibroblasts depleted of ATM. Red and blue bars show the change in protein expression in the nuclear and cytoplasmic compartments, respectively. Data shown are expressed as the average fold change calculated between two technical replicates. The dashed line represents the normalised protein expression level in cell transfected with the control siRNA. ¥: statistically significant hits (Z-score > 2). (B) Validation of the SILAC data using Western blot. Levels of the indicated proteasome subunits were analysed in cytoplasmic and nuclear fractions after ATM depletion for 72 h using the indicated siRNA. Hsp90 and Ku80 were used as loading controls for the cytoplasmic and nuclear compartment, respectively. Densitometric quantification of the indicated proteins is reported at the bottom (N = 2). (C) Validation of the SILAC data by immunofluorescence. Localisation and expression levels of PSMD13 were analysed upon ATM depletion for 72 h using the indicated siRNA. Scale bars 50 μm. (D) Proteomics data showing the decrease in histone protein levels upon ATM depletion. The histogram shows the change in protein expression in the nuclear fraction. Data shown are expressed as the average fold change calculated between two technical replicates. The dashed line represents the normalised histone expression level in cells transfected with the control siRNA. ¥: statistically significant hits (Z-score < 2). (E) Representative Western blot analysis validating the results presented in panel A and showing a decreased amount of histones upon ATM depletion. TIG1 fibroblasts were treated with the indicated siRNA and acid-extracted protein fractions were analysed 72 h post transfection. A Coomassie-stained gel is used to show equal loading. Densitometric quantification of the indicated proteins is reported at the bottom (N = 2). Results are expressed as mean from the indicated number (N) of independent experiments.

