Figure 5.
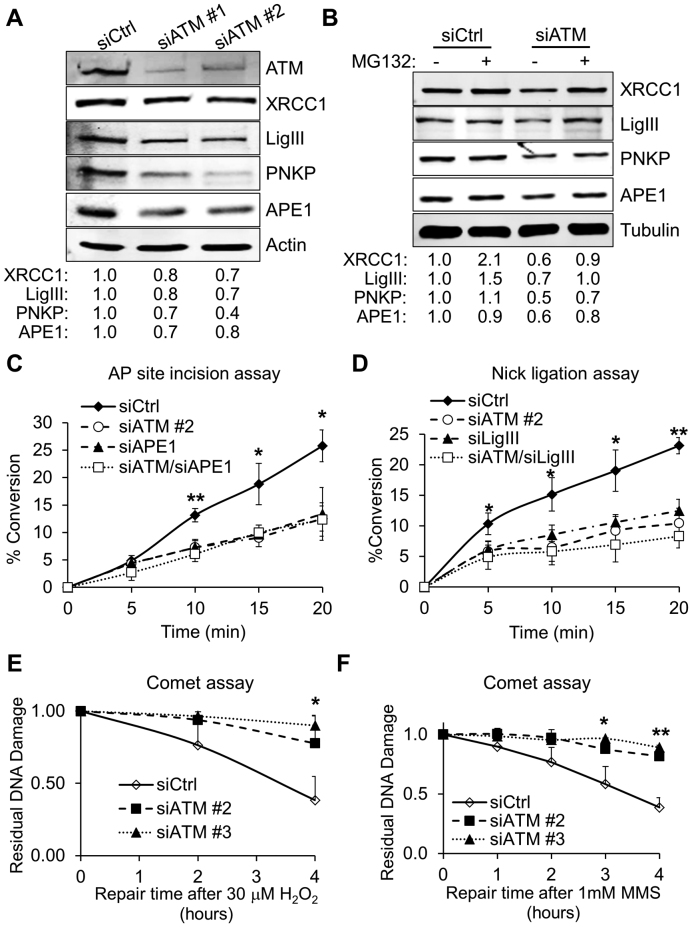
Reduced BER capacity in ATM-depleted fibroblasts. (A) Representative Western blot comparing BER protein levels in whole cell extracts from TIG1 cells. Protein extraction was carried out 72 h after transfection with the indicated siRNA. Fold change in protein expression relative to the control sample (siCtrl) is indicated at the bottom of the blot. Actin was used as loading control (N = 4). (B) Representative Western blot comparing BER protein levels in whole cell extracts from TIG1 cells depleted of ATM in the presence of proteasome inhibitor. MG132 treatment (10 μM, 6 h) was carried out before cell harvesting, 72 h after transfection with the indicated siRNA. Fold change in protein expression relative to the control sample is indicated at the bottom of the blot. Tubulin was used as loading control (N = 3). (C) AP site incision assay showing impaired endonuclease activity at abasic sites in cells treated with the indicated siRNA. The assay was carried out as described in ‘Materials and Methods’ using whole cell extracts obtained from cells treated as indicated (N = 3). (D) Nick ligation assay showing impaired SSB ligation activity in ATM-depleted cells. The assay was carried out as described in ‘Materials and Methods’ using nuclear cell extracts obtained from cells treated with the indicated siRNA (N = 3). (E) Alkaline comet assay showing slower DNA repair kinetics for ATM-depleted cells. TIG1 fibroblasts were transfected with the indicated siRNA; 72 h after transfection cells were treated with H2O2 (30 μM, 10 min) and allowed to repair for the indicated amount of time. DNA repair is expressed as fraction of residual DNA damage after H2O2 treatment (N = 3). (F) Alkaline comet assay showing slower DNA repair kinetics in ATM-depleted cells. TIG1 fibroblasts were treated as in panel E using MMS (1 mM, 10 min) and allowed to repair for the indicated amount of time. DNA repair is expressed as fraction of residual DNA damage after MMS treatment (N = 3). Results are expressed as mean ± SD from the indicated number (N) of independent experiments: *P < 0.05; **P < 0.01.

