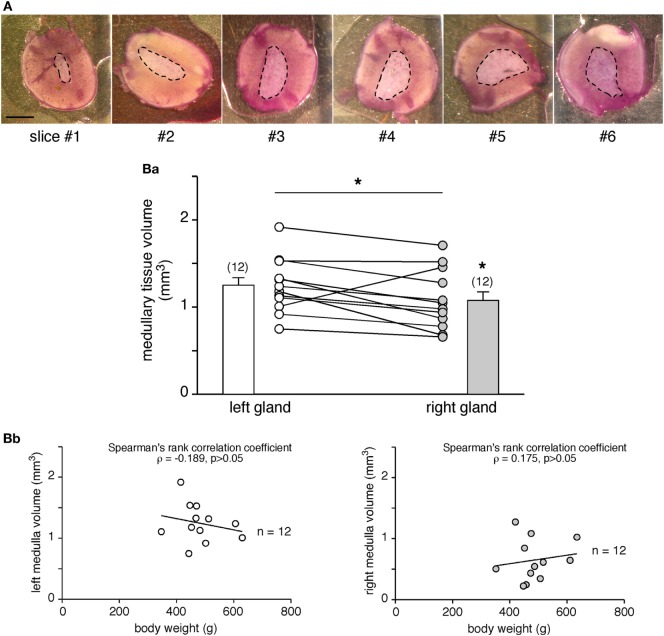
Figure 3.
Comparison of the adrenal medulla volume between the left and the right glands. (A) Pictures illustrating the medulla surface (dashed line) in six serial slices (hematoxylin labeling) of the same adrenal gland. As expected from the anatomy of the rat adrenal gland and the central location of the medullary tissue, the medulla is smaller in the first cut slices (#1 and #2) and gradually increases in the deeper slices (#4, #5, and #6). Scale bar: 1 mm. [(B), a] Calculation of the medulla volume in the left and right glands of 12 rats. The statistical analysis of the paired data indicates that the left medullary tissue is significantly greater than the right one (non-parametrical Wilcoxon’s matched pair test, *p < 0.05). [(B), b] No significant correlation between the medullary tissue volume and the body weight (Spearman’s rank correlation coefficient ρ = −0.189 for the left gland, p > 0.05 and ρ = 0.175 for the right gland, p > 0.05).

