
Fig. 3.
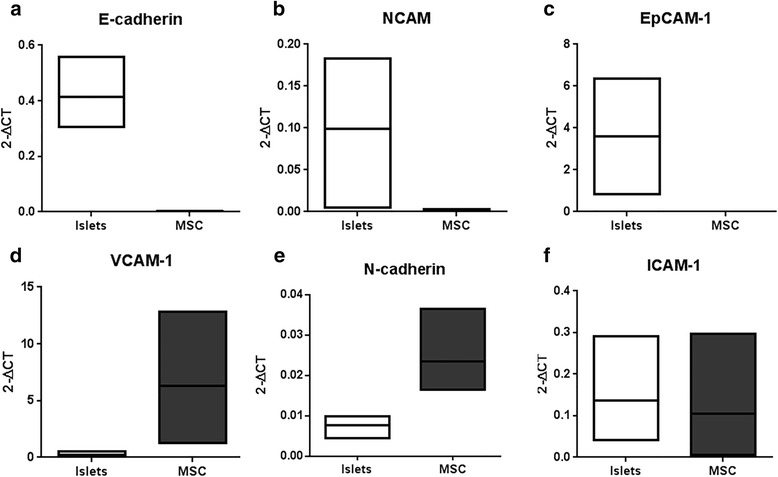
Gene expression of adhesion molecules in islets and MSC. Quantitative RT-PCR was performed to assess adhesion molecule expression and values were normalized to the expression of housekeeping ribosomal protein large P0. Expression of epithelial (E)-cadherin (a), neural cell adhesion molecule (NCAM) (b), epithelial (Ep)CAM-1 (c), vascular (V)CAM-1 (d), N-cadherin (e), and intercellular (I)CAM-1 (f) measured in islets (white boxes) and MSC (black boxes) after a 3-day culture period. Data from three islet donors presented as floating bars (minimum to maximum) with the line presenting the mean value