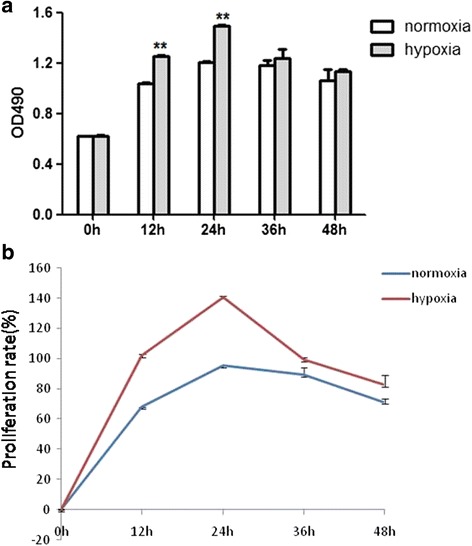
Fig. 1.

CSCs proliferation at different time points after hypoxia exposure. a CSCs proliferation rate tested by MTS. b Detection of the proliferation rate at different time points. Proliferation rate = OD (optical density) values at other time points divided by OD value at the beginning (same sample) × 100%. **p < 0.01 vs normoxia
