
Fig. 1.
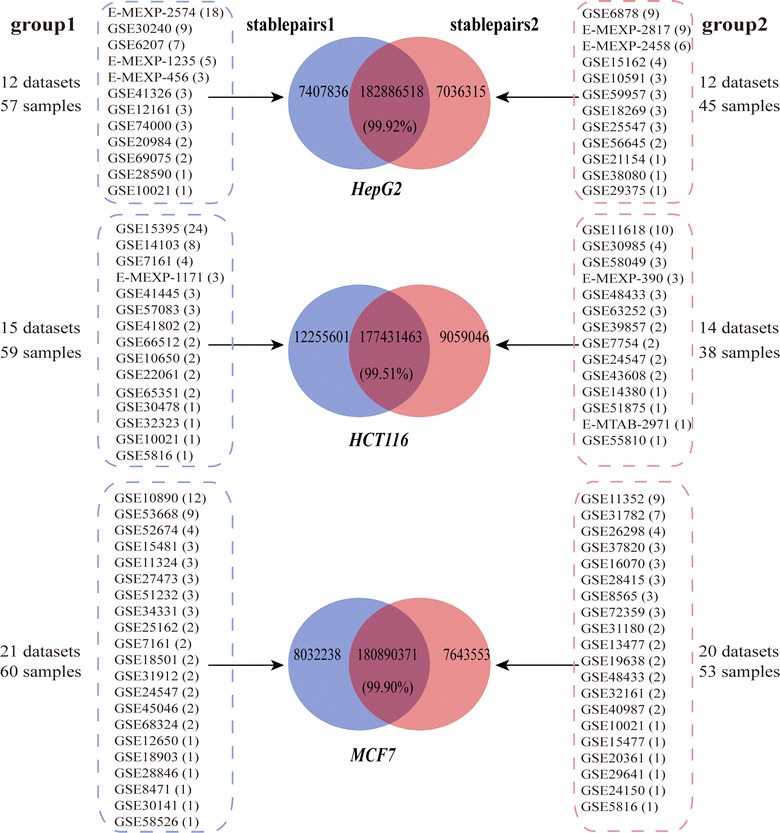
The control samples of HepG2, HCT116 and MCF7 cell line collected from different laboratories. Samples for each type of cell lines were divided into two group, referred to as group1 and group2. Blue pie represents the stable gene pairs1 identified in the group1, red pie represents the stable gene pairs2 identified in the group2. The overlap in the pie represent common gene pairs in the stablepairs1 and stablepairs2 and the number in the brackets represent the consistency score, which denotes the percentage of common gene pairs in stableparis1 and stableparis2 that display the same REO patterns