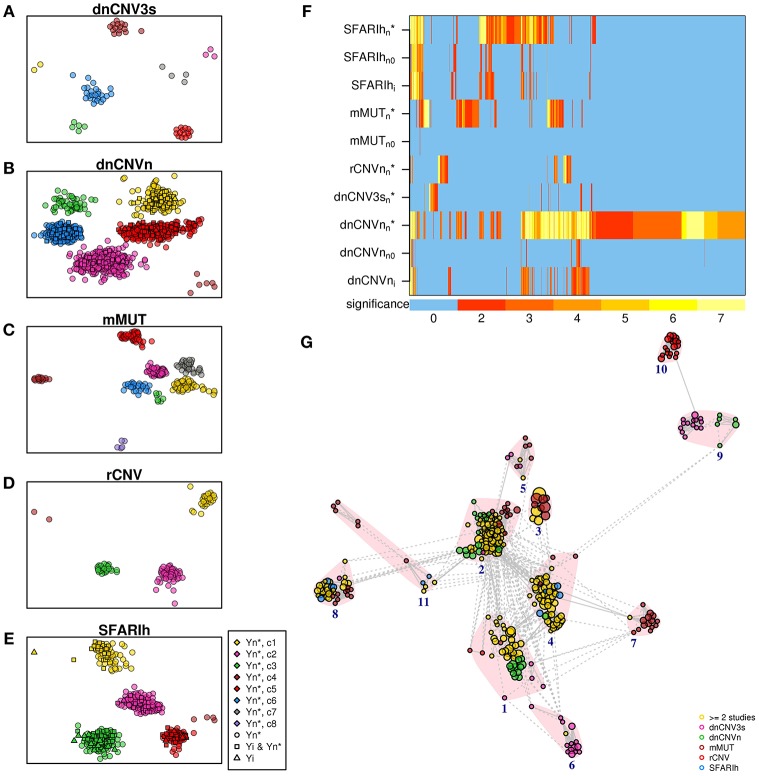
Figure 7.
Significant pathways enriched in genes associated with ASD. (A–E) Pathways found in the analysis of each original list (i) and corresponding predicted genes (n*). (F) Heatmap of all the pathways found in the analysis of the lists reported on the rows; also pathways found analyzing the original lists without genes not occurring in the STRING network (n0) are represented; the color bar indicates the −log10(p) of the hypergeomtric p-value, adjusted for multiple hypothesis testing; the number 7 indicates p ≤ 10−7. (G) Enrichment map; vertex size is proportional to pathway significance (adjusted p-value); links are reported only for overlap coefficients >0.5; for each pathway, only the links with the top 5 most similar pathways are drawn. (A–G) See Supplementary Table 6.

