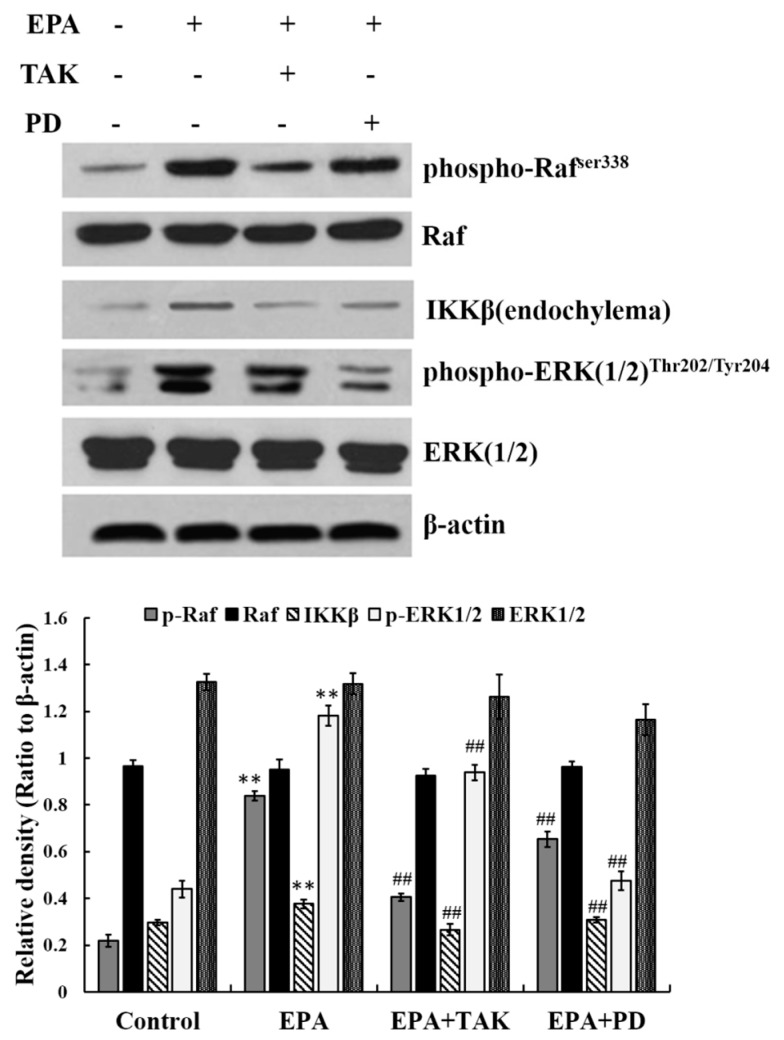
Figure 4.
The relationship among ERK1/2, Raf and IKKβ. Cells were treated with DMSO (equivalent volume 3.0 μM EPA, as conrtrol) or 2.4μmolof EPA for 24 h in the presence or absence of 10 μmol PD or 25 nmol TAK. The expression of protein was analyzed by Western blot. The β-actin was used as an equal loading control. Each bar is representative of 6 independent experiments, and data were analyzed by ANOVA and Duncan’s multiple range tests (means ± SD, ** p < 0.01 compared with the control; ## p < 0.01 compared with EPA group).

