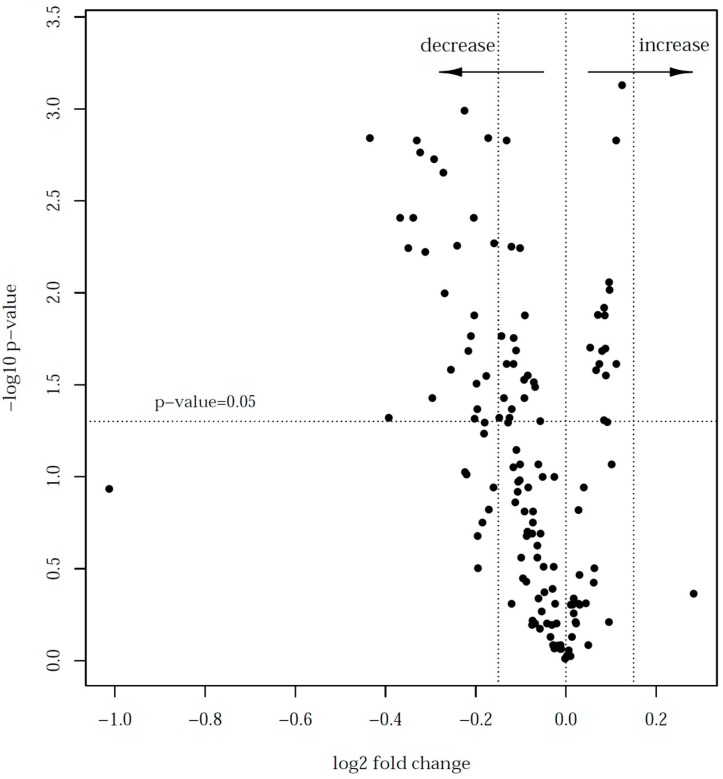
Figure 5.
Volcano plot for the comparison of proteins in low- versus high-heat treated milk samples. The log two-fold change of protein expression between low- and high-heat treated milk samples is plotted against the corresponding p-values from a t-test given as negative decadic logarithm. A negative log two-fold change indicates a decrease in LFQ levels.

