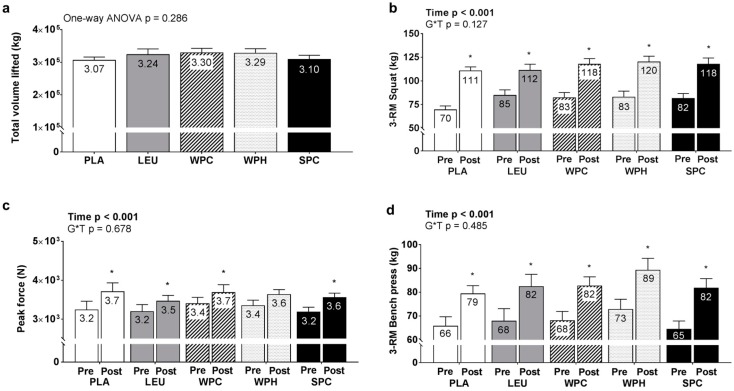
Figure 3.
Total volume lifted and changes in strength measures between groups. Legend: Data include total volume lifted during the 12-week training intervention (panel a) as well as pre- and post-intervention 3-repetition maximum (RM) squat values (panel b), 3-RM bench press values (panel c), and isometric mid-thigh pull (IMTP) peak force values (panel d). Each bar graph depicts group averaged data presented as mean + standard error values, and mean values are presented within each bar. Additional abbreviations: PLA, maltodextrin placebo; LEU, L-leucine; WPC, whey protein concentrate; WPH, whey protein hydrolysate; SPC, soy protein concentrate; Symbol: * within-group increase from pre- to post training (p < 0.05).

