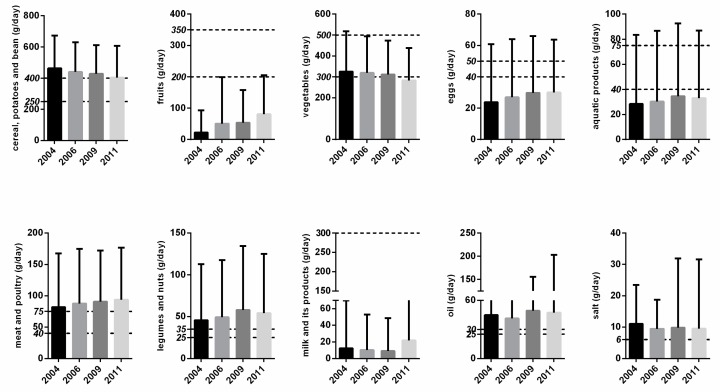
Figure 1.
Consumption of individual food groups from 2004 to 2011. Note: The horizontal dashed line refers to the recommended consumption level. The upper line refers to the upper bound, while the lower line refers to the lower bound. The lower and upper bounds for cereal, potato and beans, fruits, vegetables, eggs, aquatic products, meat and poultry, legumes and nuts, milk and its products, and oil are 250/400, 200/350, 300/500, 40/50, 40/75, 40/75, 25/35, 25/30, respectively. Only one standard was set for milk and salt in the Chinese Food Pagoda, which are 300 (lower bound) and 6 (upper bound), respectively. The bar refers to the mean consumption, and the solid black short line above the bar refers to mean ± standard deviation.

