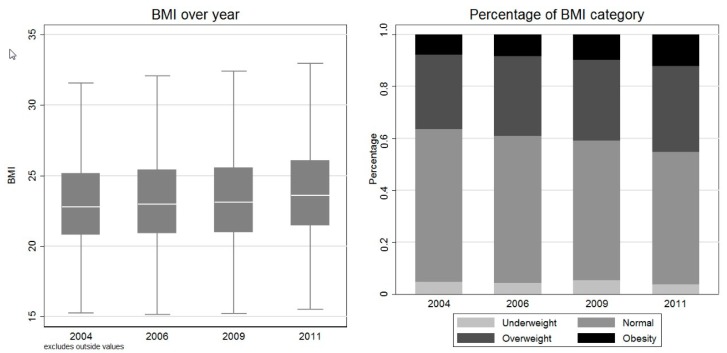
Figure 2.
Changing BMI over year. Note: The box in the left panel is the 75% and 25% percentiles, and the white line within the box is the median value. Two gray horizontal lines refer to the upper and lower adjacent values. The upper adjacent value = 75th percentile + 1.5 × (75th percentile − 25th percentile), and the lower adjacent value = 25th percentile − 1.5 × (75th percentile - 25th percentile). Outside values, which are defined as those greater than the upper adjacent value or smaller than the lower adjacent value, are excluded from the box graph.

