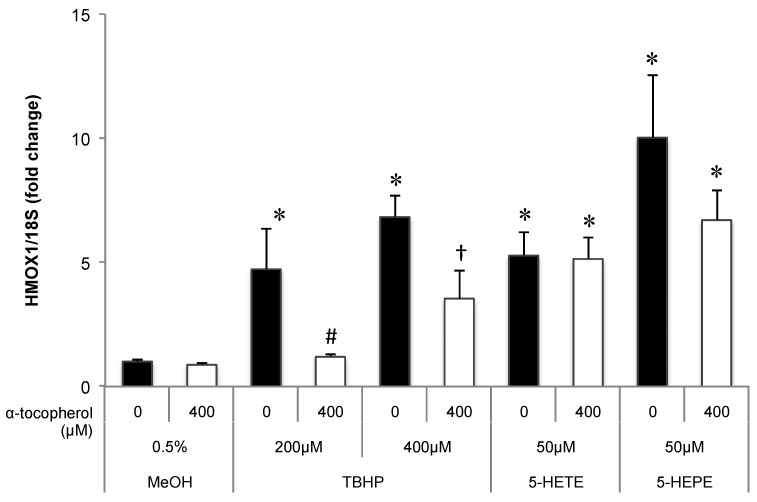
Figure 4.
Effects of antioxidant treatment on HMOX1 upregulation by hydroxy fatty acids in HUVECs. Cells were pretreated with 400 μM α-tocopherol for 1 h; subsequently, 0.5% MeOH, 200 μM TBHP, 400 μM TBHP, 50 μM 5-HETE, or 50 μM 5-HEPE was added. After incubation with each sample for 6 h, gene expression of the cells was analyzed. Data are expressed as mean ± SD (n = 3). * p < 0.05 compared with 0.5% MeOH; # p < 0.05 compared with 200 μM TBHP; † p < 0.05 compared with 400 μM TBHP. Statistics analysis was performed with one-way ANOVA followed by Tukey’s test.

