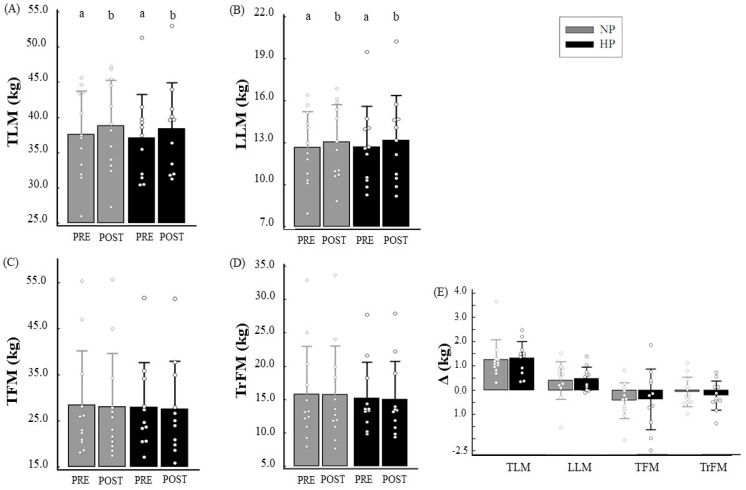
Figure 5.
Total lean mass (TLM) (A), leg lean mass (LLM) (B), total fat mass (TFM) (C), and trunk fat mass (TrFM) (D) according to time and groups, and their respective deltas (E). Notes: Δ: delta values; Generalized Estimating Equation (GEE) with sequential Sidak post hoc was performed to evaluate the intake between the groups and during the study; independent t-test was performed to evaluate the difference between deltas. Different letters (a, b) mean p < 0.05.

