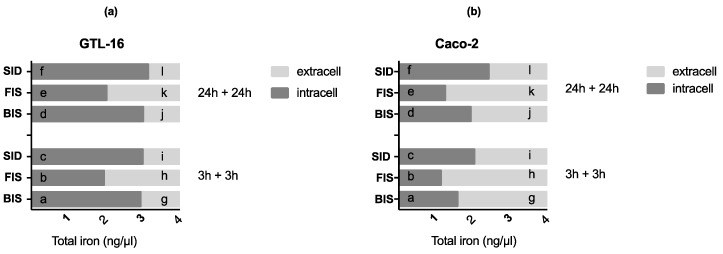
Figure A4.
Total iron quantification in GTL-16 (a) and Caco-2 (b) cells treated with different iron formulations at 3 h plus 3 h and 24 h plus 24 h. The graphs show the iron movements quantified. Results are expressed as mean ± SD of four independent experiments for each cell type. In (a) a p < 0.05 vs. b, c, d; b p < 0.05 vs. c; d p < 0.05 vs. e; c, e p < 0.05 vs. f; g p < 0.05 vs. h, i; h p < 0.05 vs. i; j p < 0.05 vs. k; i , k p < 0.05 vs. l. In (b), a p < 0.05 vs. b, c, d; b p < 0.05 vs. c; d p < 0.05 vs. e, f; c , e p < 0.05 vs. f; g p < 0.05 vs. h, i, j; h p < 0.05 vs. i; j p < 0.05 vs. k, l; i p < 0.05 vs. l.

