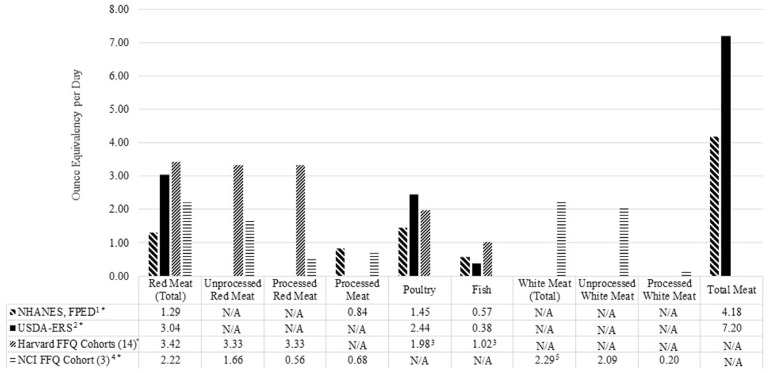
Figure 1.
Comparison of muscle food groupings and estimated intakes (ounces *) from food frequency questionnaires (FFQ), food disappearance data, and dietary recalls. 1 Adapted from United States Department of Agriculture, Agricultural Research Service, National Health and Nutrition Examination Survey, What We Eat in America, Food Pattern Equivalency Database 2013–2014 dataset available at [12] 2 Adapted from United States Department of Agriculture, Economic Research Service, Food Availability (Per Capita) Data System, Loss-Adjusted Food Availability, Meat, poultry, fish, eggs, and nuts, and fish. USDA-ERS per capita availability reflects supply at the consumer level adjusted for loss from primary, retail and consumer sources of loss or waste. More information about adjusting for loss can be found at [9]. 3 Weighted means were calculated for the median quartile of intake based on a three-ounce serving. 4 Baseline pooled median quartile intake was reported as g/1000 kcal from the National Institute of Health American Association of Retired Persons (NIH-AARP) cohort that used the National Cancer Institute Diet History Questionnaire II (NCI FFQ); intake levels presented in this figure are calculated ounce equivalents converted from g/2000 kcal. 5 White meat in the NIH-AARP cohort is inclusive of poultry and fish. N/A = Data not available. * 1 ounce ≈ 28 g.

