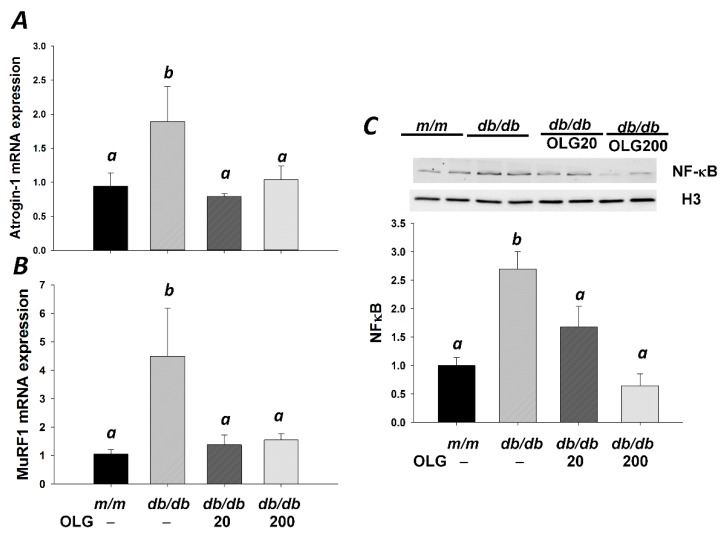
Figure 2.
Gene expression was analyzed using real-time PCR analysis in gastrocnemius muscle from m/m and db/db mice with or without oligonol (OLG) supplementation. Atrogin-1 (A) and MuRF1 (B) mRNA expression is expressed as mean ratio to control after normalization with 18S mRNA levels. Fold differences were calculated using the ΔΔCt method. Values presented are mean ± SEM (n = 5–6/group). Protein expression was analyzed using Western blotting with anti-NF-κB and -Histone H3 antibodies in gastrocnemius muscle (C, n = 4–5/group). Significance (p < 0.05) among groups is denoted by different letters.

