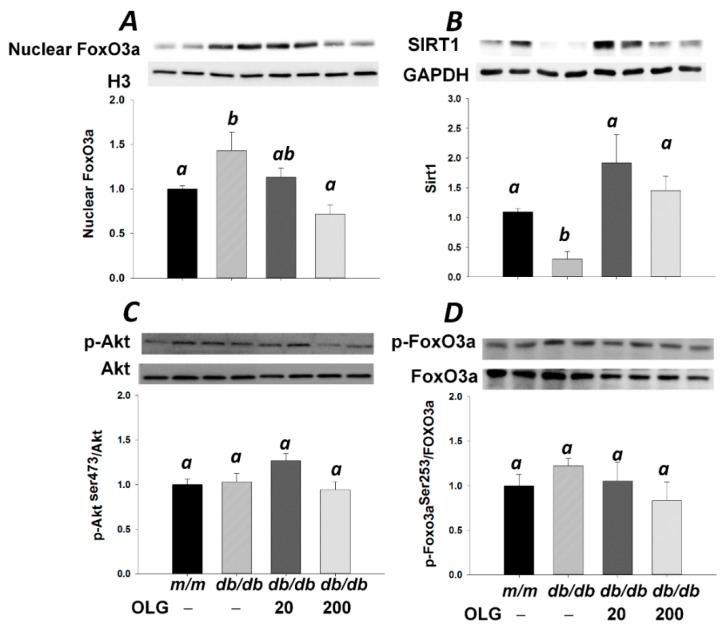
Figure 3.
Representative blots of nuclear FoxO3a (A), SIRT1 (B), phospho-Akt (Thr473), Akt (C), phospho-FoxO3a (Ser253), and total FoxO3a (D) in m/m and db/db mice with or without oligonol (OLG) supplement are shown (n = 5–6/group). Significance (p < 0.05) among groups is denoted by different letters.

