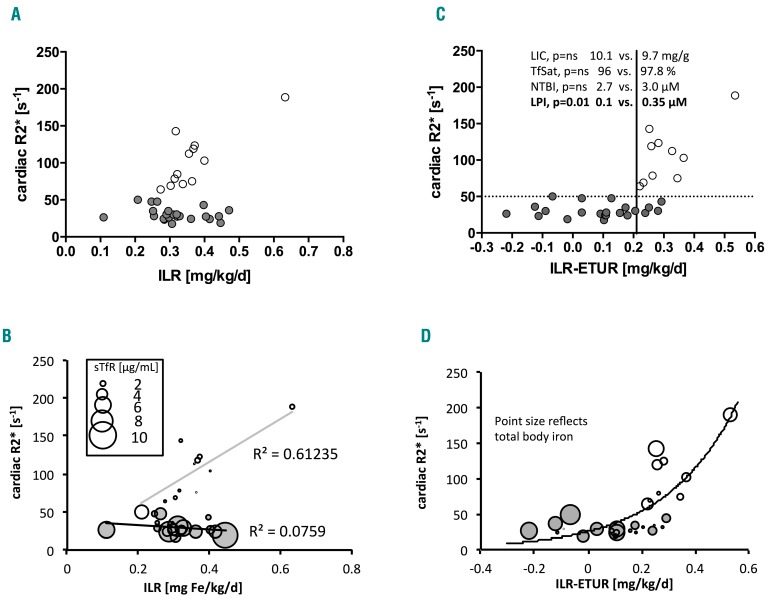
Figure 2.
Balance between transfusion-iron load rate and erythroid transferrin uptake rate derived from soluble transferrin receptor-1 relates to cardiac iron. (A) Cardiac R2* plotted against transfusion-iron load rate (ILR), gray circles mark patients with cardiac iron (cR2*>50 s−1), open circles – patients without cardiac iron; no relationship overall. (B) Cardiac R2* (cR2*) plotted against ILR, open circles mark patients with cardiac iron (cR2*>50 s−1), gray circles – patients without cardiac iron; no relationship overall, relationship present in patients with cardiac iron only, r2=0.61; points differ in size according to sTfR1 level [μg/mL], see inset. (C) same as in panel B but the x-axis shows ILR corrected for utilization rate derived from sTfR1 according to Beguin et al. 199329 (ETU[μmol/L/day]=0.013×sTfR1 [μg/L]+2.25; ETUR[mg/kg/day]=ETU×55.845[g/mol]/1000×blood volume[mL]/1000/body weight[kg]). Highly discriminant threshold 0.21mg/kg/day P<0.0001, 100% sensitive, 83% specific for myocardial hemosiderosis (positive predictive value 71%, negative predictive value 100%) above and below which the liver iron concentration (LIC), transferrin saturation (TfSat) and non-transferrin-bound iron (NTBI) do not differ (P=ns) but labile plasma iron is 0.35 μM vs. 0.1 μM P=0.01, respectively. (D) same as panel C but points differ in size according to total body iron derived from LIC values.

