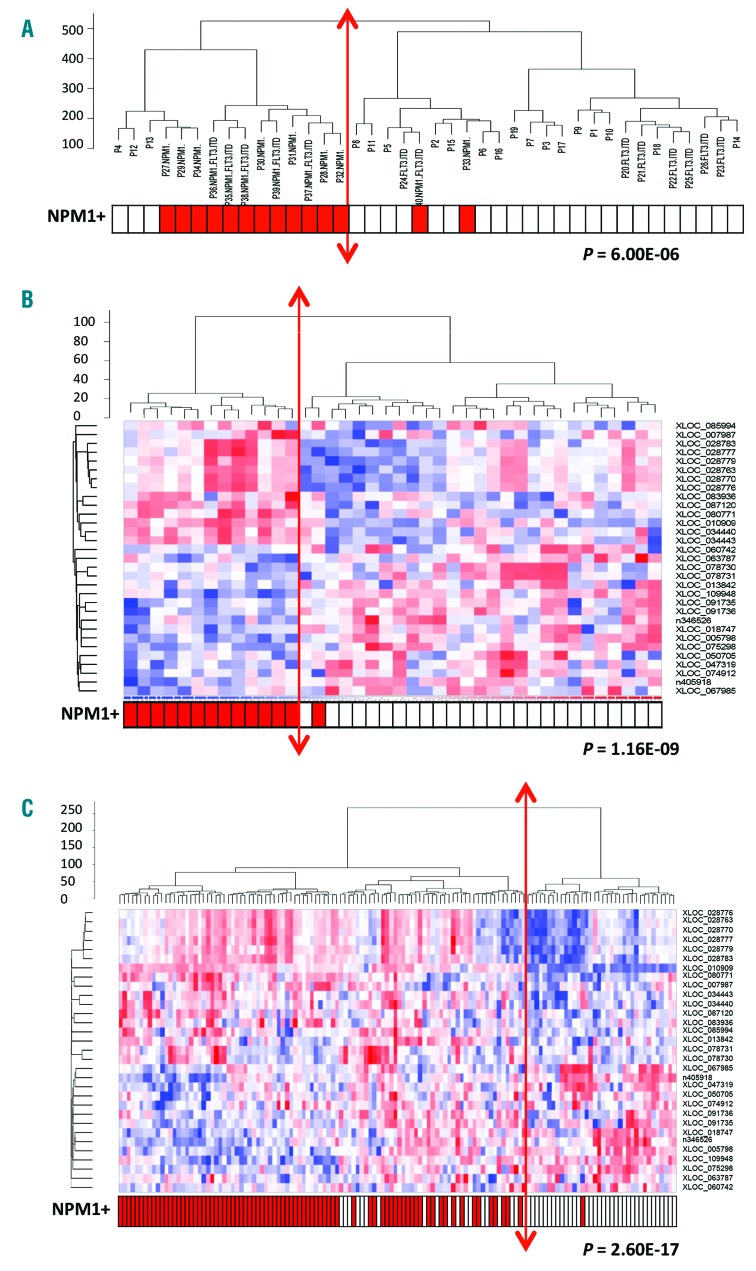
Figure 2.
Specific lncRNA expression profile for NPM1-mutated AML patients with normal cytogenetics. (A) Unsupervised hierarchical clustering analysis of 40 patients with cytogenetically normal acute myeloid leukemia (CN-AML) (Cohort 1: NPM1+, n=14; NPM1wt, n=26) using 11065 lncRNAs (RNA-seq data). (B) Hierarchical clustering and associated heatmap of Fluidigm data from the first cohort of CN-AML patients (n=40) with 31 lncRNAs differentially-expressed between NPM1-mutated (n=14) and NPM1-wild-type patients (n=26). (C) Hierarchical clustering and associated heatmap of Fluidigm data from the second cohort of 134 CN-AML patients [NPM1-mutated (n=80) and NPM1-wild type (n=54)]. The heatmap depicts high expression (red: +1) and low expression (blue: −1).

