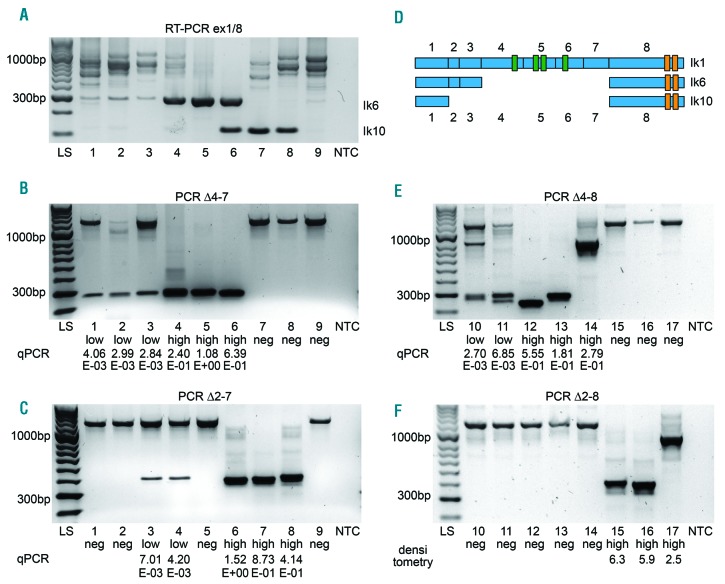
Figure 2.
Detection of IKZF1 deletions by RT-PCR and PCR screening. (A–C) RT-PCR ex1/8, PCR Δ4–7 and PCR Δ2–7 of the same 9 patients. (A) RT-PCR with primers in exon 1/8. Increased Ik6 expression in lanes 4–6 and increased Ik10 expression in lanes 6–8. Reduced full length isoform expression in lanes 1 and 7 is attributed to an additional deletion Δ2–3 in these 2 patients detected by another RT-PCR (see Online Supplementary Figure S2). (B) PCR Δ4–7. In lanes 1–3, Δ4–7 is present with a low deletion load; in lanes 4–6, the deletion is present with a high deletion load. Corresponding qPCR results are given below. Control band of 1257bp. (C) PCR Δ2–7 with low deletion load in lanes 3–4 and high deletion load in lanes 6–8. Control band of 1257bp. (D) Structure of the IKZF1 transcript isoforms Ik1 (full-length), Ik6 (loss of exons 4–7) and Ik10 (loss of exons 2–7). (E and F) PCR Δ4–8 and PCR Δ2–8 of the identical patients in lanes 10–17. Control band of 1229 bp. (E) PCR Δ4–8. See double bands in lanes 10 and 11. (F) PCR Δ2–8. See variant breakpoint in lane 17.

