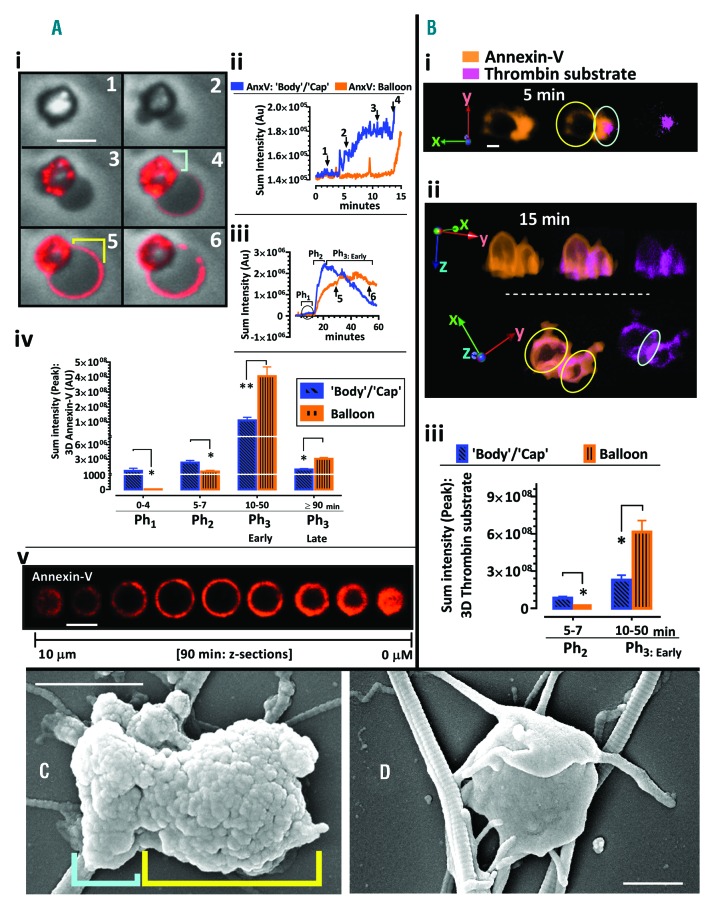
Figure 1.
Spatio-temporal dynamics of the procoagulant response of human platelets in contact with collagen. Using spinning-disk confocal microscopy, human platelets were monitored while adhering to collagen fibres. Fluorescence intensity against time was recorded in platelets pre-incubated with Alexa568-Annexin-V. A: Chart and superimposed phase contrast and fluorescent annexin-V (red) images of the ballooning platelet captured the differential spatiotemporal accumulation of annexin-V on the platelet body (or cap) (indicated by cyan lines) and balloon (indicated by yellow lines). Sum intensity of annexin-V accumulated over time is plotted in A-ii & A-iii. The phases of membrane ballooning as previously described by Agbani et al., 20152 is annotated on A-iii and A-iv. Number on images (A-i) corresponds to time points as indicated by the numbered arrows of chart (A-ii and A-iii). Sum annexin-V accumulated on the platelet body (or cap) and the balloon was evaluated for the various phases of membrane ballooning and plotted in A-iv. In A-v, Z-sections of a ballooned human platelet separated by 1 μm is shown after 90 min. Platelet is loosely adherent to collagen matrix and stained with Alexa568-Annexin-V. B: By means of a fluorogenic thrombin substrate, Z-GGR-AMC, thrombin activity (magenta) was visualized in collagen adherent platelets of platelet-rich plasma showing annexin-V rich balloons (orange). Related to Online Supplementary Movie S1. B-i, B-ii show 3D images of these platelets at 5 and 15min, respectively. The body (or cap) and balloons of these conjoined platelets are delineated by cyan and yellow circles, respectively. The sum intensity of the thrombin substrate was evaluated and shown in B-iii, for both the platelet body (or cap) and the balloon. C–D: show scanning electron microscopy (SEM) images of procoagulant (C) and non-procoagulant (D) phenotype of washed human platelets adherent to collagen. SEM images (C and D) and fluorescence live images (A-i) were derived from the same donor. Cyan and yellow brackets delineate the platelet body (or cap) and balloon, respectively in C. Data analysis was by Wilcoxon signed rank test, P<0.05 (*) was considered significant. Scale bar represents 2 μm (A-i, A-v, & C) or 1 μm (B, D)’. Data are representative of platelets from 8 (A and B) and 4 (C and D) human donors. Details of the microscope and the software used for the image analysis are as previously reported by Agbani et al., 2015.2

