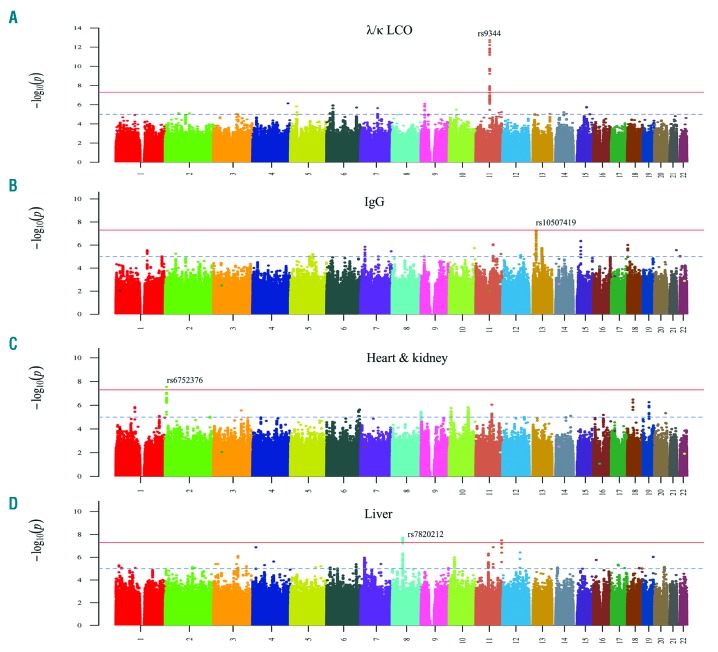
Figure 1.
Manhattan plots of association analysis for AL amyloidosis clinical profiles with genome-wide significant results. (A) λ/κ LCO profile; (B) IgG profile; C) heart + kidney profile; D) liver profile. The x-axis shows the chromosomal position and the y-axis is the significance (−log10 P; 2-tailed) of association derived by logistic regression. The red line shows the genome-wide significance level (5×10⁻⁸) and the blue line shows suggestive significance level (1×10⁻⁵). The significant/top SNPs are labeled. In the liver profile a genome-wide significant association, based on imputed SNPs, was noted in chromosome 11 but it had a MAF of 1%; thus few individuals had the variant allele and the association was considered no further. Ig; immunoglobulin; LCO: light chain only.

