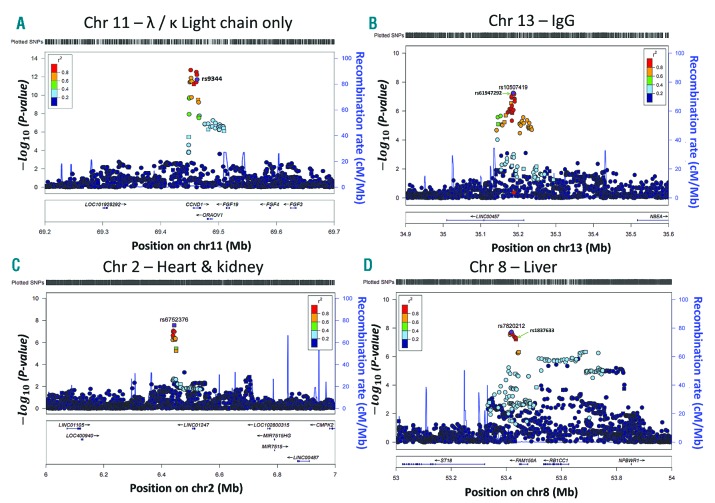
Figure 2.
Regional association plots showing the significant/top SNPs in the four AL amyloidosis clinical profiles. (A) λ/κ LCO profile; (B) IgG profile; C) heart + kidney profile; D) liver profile. The x-axis shows the chromosomal position as Mb and the mapped genes annotated from the University of California, Santa Cruz (UCSC) genome browser. Genomic locations are given in the National Center for Biotechnology Information (NCBI) Build 37/UCSC hg19 coordinates. The y-axis shows the significance (−log10 P; 2-tailed) on the left and recombination rates (light blue lines) on the right. The reference SNP is labeled and colored purple, the rest of the SNPs are colored based on their r2 to the reference SNP, on a shown scale, based on pairwise r2 values from HapMap CEU. Square-shaped SNP symbols represent genotyped SNPs and circle-shaped SNPs represent imputed ones. In B) and D) second SNPs are also marked (rs61947292 and rs1837633, respectively) as these are among the targets of the Hi-C experiments shown in the Online Supplementary Figures S2 and S3. Chr: chromosome. Ig: immunoglobulin.

