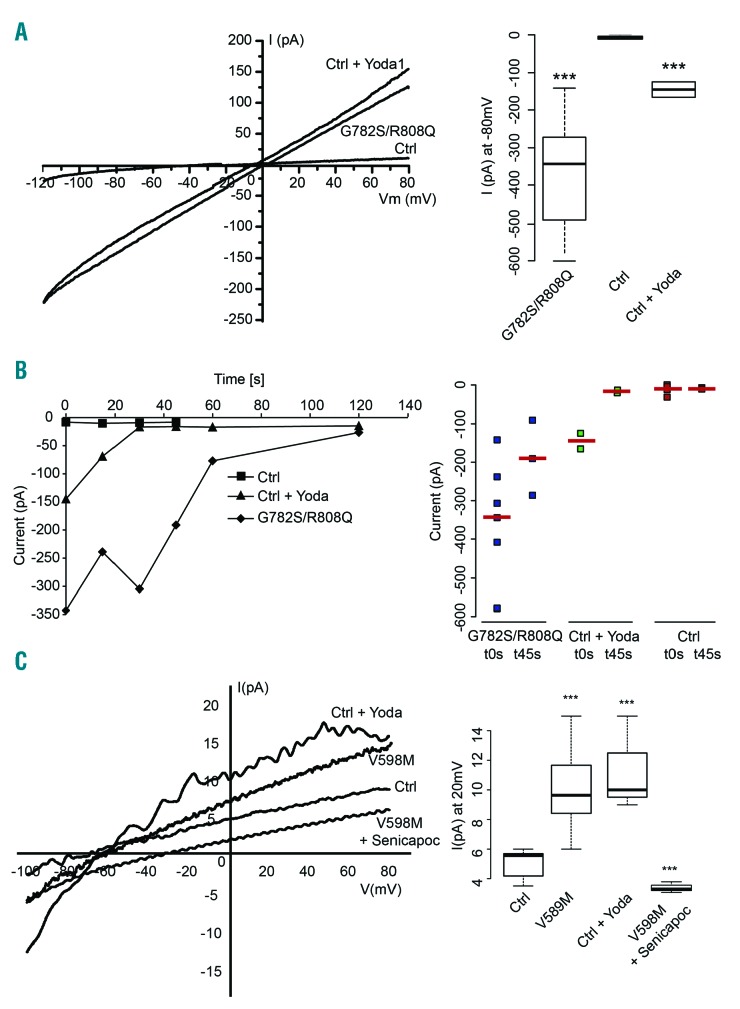
Figure 1.
Electrical features of patient red blood cells with Piezo1 mutations. All patch-clamp experiments were performed with a PC-controlled EPC 9 patch-clamp amplifier (HEKA, Lambrecht/Pfalz, Germany). Currents were acquired and analyzed with Pulse and Pulsefit software (HEKA). Whole-cell configuration was used and hematocrit was around 0.1% (10μl of a 30% suspension in 2ml dish). Glass pipettes (Brand, Wertheim, Germany) were made on a horizontal pipette puller (PIP5 HEKA, Germany) to give a final resistance ranging from 18 to 20 MΩ. The bath solution was in mM: NaCl 150, KCl 5, MgCl2 1, CaCl2 1, Hepes 10, buffered with NaOH pH7.4 (320 mOsm). The intracellular solution was in mM: KCl 140, NaCl 5, MgCl2 1, Hepes 10 pH 7.2 adjusted with NaOH, 0.5 μM CaCl2. Currents were measured at room temperature using a ramp protocol from −120 to +80 mV from a holding potential of −60 mV for 250 ms every 5 s (sampling frequency 10 kHz; filtered 1 kHz). (A) Representative I/V curves of patient or control red blood cells. Currents were recorded just after cell break-in. Bath solution containing 15 μM Yoda1, a specific Piezo1 activator (Syeda R. et al., Elife 2015;4) was prepared just before adding the cell suspension. Quantification: currents recorded at −80 mV, n=5 (ctrl) 7 (patient) 2 (Ctrl+Yoda1). B) left panel: time course of currents measured at −80 mV for control, control+15 μM Yoda1 or patient with G782S/R808Q Piezo1. Data are median currents n=5 (ctrl) 7 (patient) 2 (Ctrl+Yoda1). For clarity purpose the dispersion around median was not shown but each individual currents with corresponding median values are reported for t=0 and t=45 s in the graph on the right. C) Representative I/V curves of patient (V598M mutation) or control red blood cells recorded after extinction of the large conductance between 90 and 120 s depending on cells. Inset median currents recorded at +20 mV, n=5 (ctrl) 7 (patient) 3 (patient + Senicapoc) 3 (ctrl+ Yoda1).

