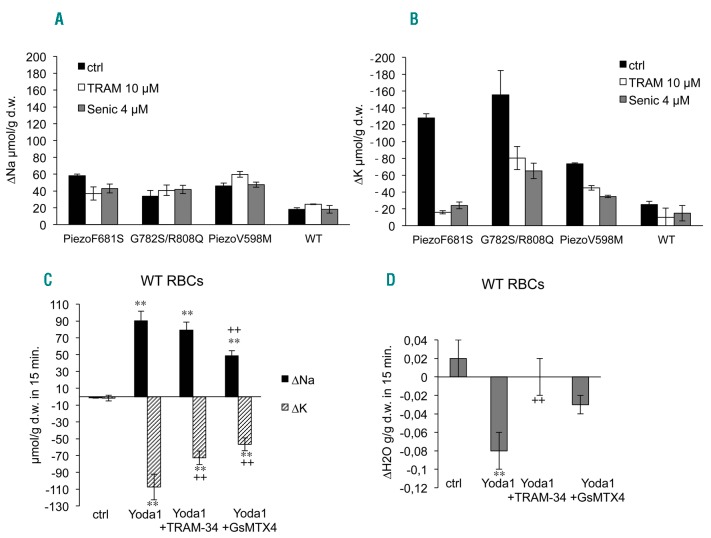
Figure 3.
Variation in intracellular Na+ and K+ contents in control or patient red blood cells following 18 hours’ incubation at 37°C (A and B) or after stimulation of Piezo1 by Yoda1 in control RBCs (C and D). Variation in intracellular Na+ (A) and K+ (B) contents in blood samples used for osmotic resistance tests, i.e., RBC suspension at 40% hematocrit. Intracellular ion contents were measured as previously described4 at t=0 and at the end of the incubation time and the variations in 18h are plotted in the bar graph. Data are means±sem, n=3. Black bars: control condition, white bars: 10 μM TRAM-34, grey bars: 4 μM Senicapoc. Statistical analyses were done with Mann and Whitney tests comparing control condition between WT and mutated Piezo1 on one hand and inhibitors versus control condition on the other hand. Na+ and K+ contents were significantly changed in mutant versus WT red blood cells, P<0.05 for Na+ and P<0.001 for K+. Inhibitors did not significantly change Na+ contents whereas they significantly modified K+ contents in mutant red blood cells (P<0.001) but not in control red blood cells. Cation contents at t=0 are given in Online supplementary Table S3. Cation (C) and water (D) movements in control RBCs stimulated by Yoda1. Washed RBC suspension was set to 30% hematocrit and 0.5 μM ouabain (Sigma-Aldrich) was added. At time zero, 15 μM of Yoda1 (Sigma-Aldrich) was added to cell suspension either containing 10 μM TRAM-34 (MedChemExpress), 10 μM GsMTx4 (Smartox, Grenoble, France) or DMSO. Samples were collected 15, 30 and 60 minutes after Yoda1 addition and cell water, Na+ and K+ contents were measured. Data showed the variation in 15 minutes, means ± sem of 4 experiments. **P<0.001 comparison of control condition with the 3 conditions with Yoda1. ++P<0.001 comparison between Yoda1 and Yoda1+inhibitors. Mann and Whitney test. The kinetic is shown on Online Supplementary Figure S4.

